Hello,
I ran the example in https://optics.ansys.com/hc/en-us/articles/360042097313-Metalens-Zemax-Interoperability from the project file "unit_cell.fsp".
The example simulates a pillar on a substrate, using one wavelength, whereas, I need a wvl range, so I changed the source's wavelength to 0.5-1um.
The height and radius dimensions are the same (as all other parameters from this example) -
Height =1um, Radius = 0.144um.
A few questions regarding the results -
- What is the difference between "T" and "T_Gn" or "R", "R_Gn"?
- (abs^2(S21_ Gn)) is the intensity of the transmitted beam, normalized to the incident beam. Sometimes I see results larger than 1. What does this mean? I'm attaching here the scattering data where the transmitted is larger than 1. (I also observed it happen for "S11_Gn", in other simulations).
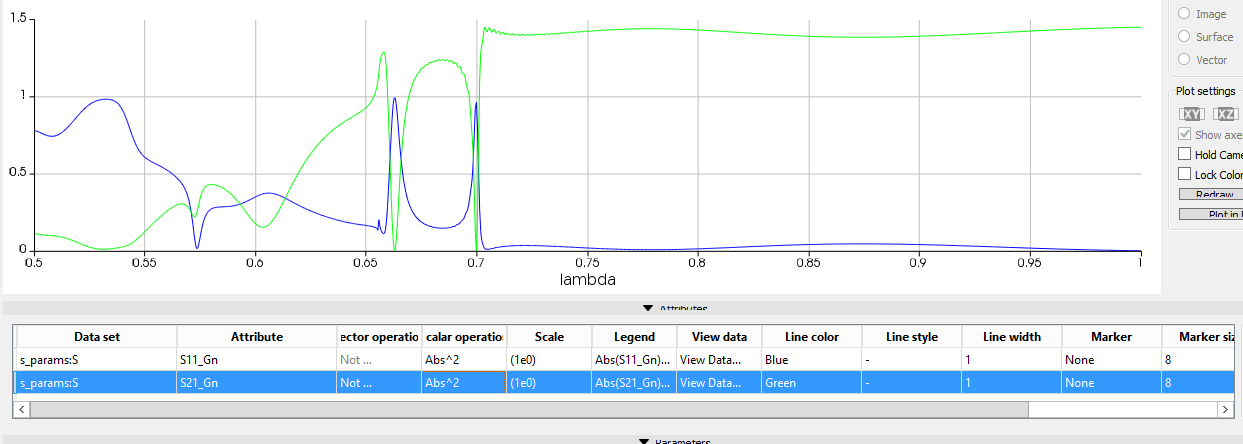
(note - the Re(S21) is also larger than 1, not just the abs^2(S21))
Next, I would like to retrieve the phase data of the transmitted beam.
I see two options to achieve that -
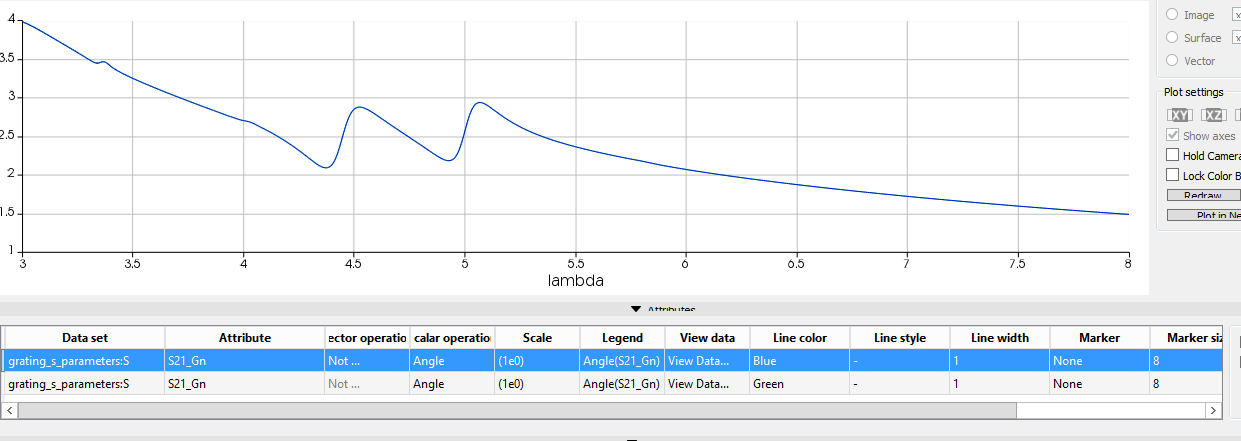
- "angle(S21_Gn)" via the GUI "S->visualize"
- By using the script "fdtd_unit_cell_plot_phase_T" after running the height and radius sweep.
the two methods give different results.
These graphs describe the scattering of my resonators (not the original example).
This graph was taken from the GUI - S->visualize (angle(S21_Gn))
And this graph was taken after running the sweep and using the script. The "S.S21" matrix dimensions are - lambda, radius, height. In order to retrieve just the phase I'm using the lines -
lambda = linspace(3, 8, 1000);
folder_name = "phase_data_tr";
for(hei=1:nd)
{
for(r=1:nd)
{
phase1 = pinch(angle(S.S21_Gn),2,r);
phase2 = pinch(phase1,2,hei);
A1 = [lambda, phase2];
filename = "phase_vs_wvl_r_" + num2str(radius(r,1))+ "_h_" + num2str(height(hei));
matlabsave(folder_name +'\'+ filename, A1);
}
}
Then I plotted the phase in matlab (for the same radius and height as in the graph above) -
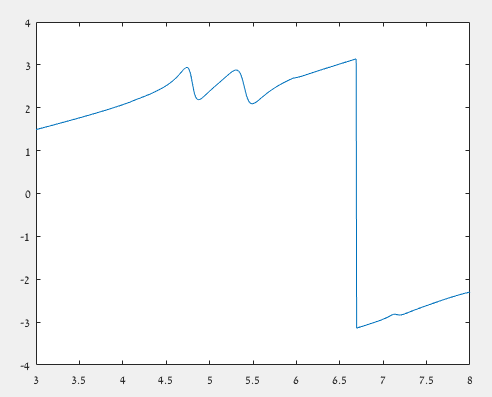
The graphs share the same behaviour for wvl =4-5.5um. However, around wvl =6.6um, the last graph shows a large dip, which has no sign in the first graph.
Which of the methods is the correct one?
One last question -
How can I get the source's wavelength (of the "grating_s_parameters" object) through the script?
I mean, I know the "start wavelength" and the "end wavelength" but are they evenly spaced?
Is it ok to use -
lambda = linspace(start wavelength, end wavelength, number of points);
in order to plot phase vs wvl?
thanks a lot in advance,
any help is much appreciated,
Shany


