Ansys Learning Forum › Forums › Discuss Simulation › Photonics › Changing X- and Y-axis range in the data visualizer › Reply To: Changing X- and Y-axis range in the data visualizer
October 25, 2021 at 9:42 pm
 niazulkhan
Subscriber
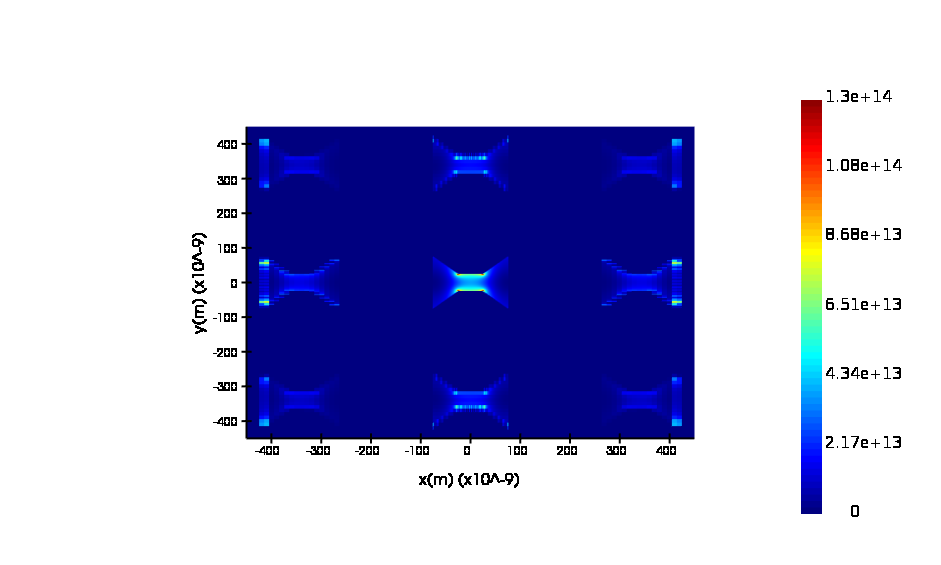
Another question I have in mind: if I extend the axis to (for example) 0.9 um x 0.9 um which will cover all the diabolo antennas of the array, I can visuazlie the absorption profile of all the antennas covered by this dimension in the Pabs visualizer as below:
However, in the heat profile I can only see one antenna as seen below. If I am doing anything wrong?
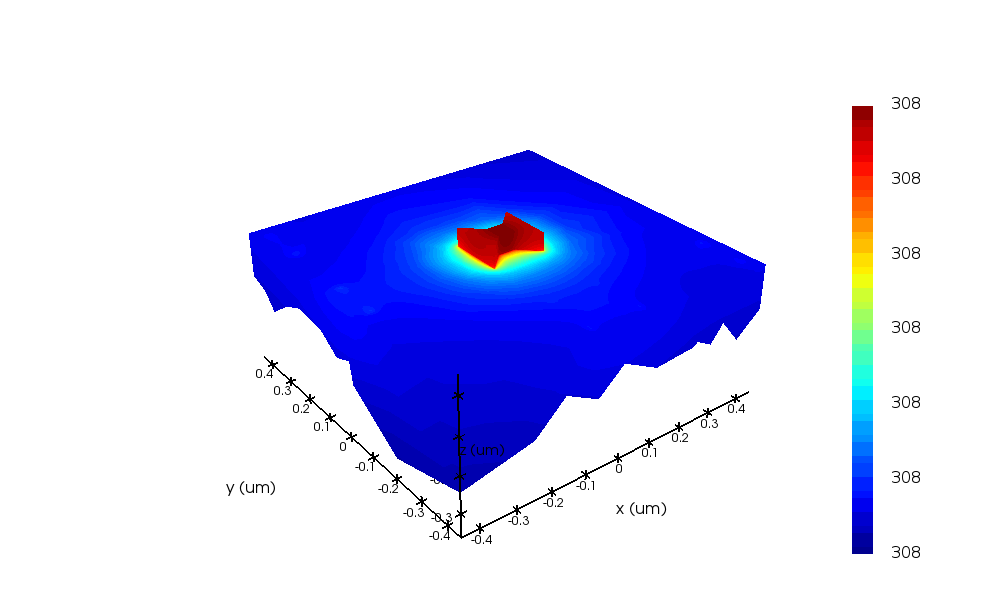
However, in the heat profile I can only see one antenna as seen below. If I am doing anything wrong?
