TAGGED: ansys-mechanical, modal-analysis, random-vibration
-
-
May 18, 2022 at 8:08 am
albin.linderstam
SubscriberHello,
I'm trying to perform my first Modal And Random Vibration Analysis.
I've watched some different Ansys tutorials and read the Mechanical User's Guide, but I've still have some questions regarding these topics.
Question 1: Number of modes to use based on maximum freq in PSD excitation table
I have a PSD curve that goes from 0-2000Hz.
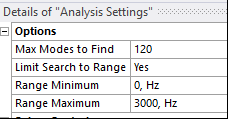
According to Mechanical User’s Guide: “A conservative rule of thumb is to include modes that cover 1.5 times the maximum frequency in the PSD excitation table”. Hence, I select all modes up to 3000Hz (which is 101 if I limit search to range).
May 18, 2022 at 8:10 amalbin.linderstam
SubscriberFurther questions (not enough room in one post):
Question 4: Type of support
PSD G Acceleration ÔÇô Should I always select All Supports here? All Ansys-videos I watched have used All Supports, but they are not specific about why. LetÔÇÖs say that IÔÇÖve used fixed support in my modal analysis, will it make any difference if I use Fixed Support or All Supports?
Question 5: Random vibration in x,y,z
Can I apply PSD G Acceleration in X, Y and Z during same simulation or do I need to take them separately? I assume separately. What is happening when I use PSD G in x,y,z simultaneously? I notice that the results change a bit.
/forum/discussion/10768/combining-multi-axis-psd-vibration-results

Question 6: What does the PSD Tool tells me, i.e. what does the PSD counts tell me? I've problem understanding this, perhaps one can use the curves below to ease explanation.
According to Mechanical User’s Guide: “You can apply a Response PSD Tool to any Random Vibration analysis (only) in order to control the frequency sampling of Response PSD probes.”
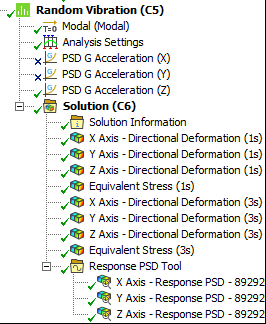
This is result when performing PSD G Acceleration in X/Y/Z-direction, see below. I assume that one only examine the Response PSD in the direction of the PSD G Acceleration, one at a time.
Since this Response PSD is measured on a vertex, is it the same as when we apply accelerometers (x,y,z)?
X:

Y:

Z:
 Question 7: What is your recommendation, total deformation and equivalent stress in 1-sigma, 2-sigma or 3-sigma? It seems conservative to use 3-sigma (which is easier to motivate).
Meachanical User’s Guide: “Meaningful equivalent stress is computed using a special algorithm by Segalman-Fulcher. Note that the probability distribution for this equivalent stress is neither Gaussian nor is the mean value zero. However, the “3 σ” rule (multiplying the RMS value by 3) yields a conservative estimate on the upper bound of the equivalent stress.”
Kind regards
AlbinMay 24, 2022 at 8:34 pmSheldon Imaoka
Ansys EmployeeHi Albin You have several questions posted, but I'll attempt to address them:
The warning message can be ignored - it is just letting you know that, if you have many modes, PSD calculations can take longer. The snapshot you showed under "Analysis Settings" is the correct place to change the tolerance for 'negligible' modes - if computational time for PSD calculations takes a while, by increasing this tolerance (e.g., 1e-3), it will be faster and should not dramatically change your results.
Effective mass changes, depending on the direction (3 translational, 3 rotational). Thus, because it's dependent on the direction you're interested in, what you are doing in checking the table for largest coefficients is the correct way to identify such modes of interest.
Having an effective mass above 0.9 is not a hard requirement but a good guideline. For example, if you only had a ratio of effective mass to total mass of 0.6, that may be too low. If most of your mass is near the constraints, you may be fine with values lower than 0.9. Usually, values above 0.8 (effective mass is 80% or more of total mass) should give reasonable results, but it depends on the level of accuracy you require and also depends on your geometry and excitation.
If you only have 1 support, both options are equivalent. There could be situations where a structure has 2 fixed supports, but only 1 support is excited - that is why you have an option of selecting 1 support or just using all supports. If your structure has 2 supports but both are being excited, then you'd pick "all supports".
It depends on the excitation. If you are expecting x, y, z directions to be excited simultaneously, then you want to include them together; if the excitation in different directions are independent, then you want to solve them separately.
I'm not sure I understand your question, but the Response PSD Tool and/or Response PSD Probe gives you the response PSD at a particular location. It would not be the same as a measurement but gives you the response PSD at a particular location. Response PSD gives you information about the response, but it could also be used as an input PSD if you had a smaller component at that location, for example.
Using 1-, 2-, or 3-sigma needs to be determined by the user. For example, if you want to know what the values will be 68% of the time, then 1-sigma is sufficient. 2- and 3-sigma give higher thresholds, so it depends on what result you want.
Regards Sheldon
May 31, 2022 at 1:55 pmalbin.linderstam
Subscriber
Thank you for your answers, very helpful!
I couple of things regarding your input:
1. Okey. I've only seen tutorials where a tolerance of 1e-4 has been used before, but if the computational time is too long, I'll use 1e-3 instead.
2. What is your approach for Mass Participation Factor and Effective Mass?
Let's say that I've performed a modal analysis with 30 modes and mode 5, 13 and 19 showed the highest value in X-direction (which is the point of interest in this case).
Do you mainly study the shapes of these three modes (5, 13, 19)? Do you only include up to mode 19 in the Random Vibrational Analysis?
I also hear a lot about that the lower frequencies are usually of interest since they contain more energy than the high frequencies and that they will cause more deformation. Is this true? If yes, is there a point looking at higher modes then? Even if they show high mass participation factor?
6. Sorry. I'll try to rephrase. If you look at the graphs X/Y/Z above, how do you interpret those graphs? We have a peak at 1000 for X, 100/400 for Y and 1000 for Z. I'm not sure what those curves and peaks tell me. Are they correlated to the Mass Participation Factor and Effective Mass? That a lot of mass is moving at these peaks?
7. Yes of course. I was simply looking for a general recommendation/rule of thumb/guideline. For example the text above, from Mechanical User's Guide, regarding 3 Sigma equivalent stress, it almost seemed like a recommendation.
8. It would also be interesting to know your general approach, i.e. a short step-by-step, for a Modal and Random Vibrational Analysis
Regards Albin
June 1, 2022 at 12:18 amSheldon Imaoka
Ansys EmployeeHi Albin Regarding the open questions you have:
2. The answer to this depends on the situation, so there is no general answer that can be given. It is true that the contribution from higher modes tends to be less, but this depends on the input PSD curve and other factors, too. So in some cases, the contribution from higher modes can be quite important. If you are uncertain or new to PSD analyses, you can run the PSD analysis twice - once with fewer modes, second time with more modes - to see what the actual difference may be.
6. This video may help you: Correctly Interpret Random Vibration Analysis Results using Ansys Mechanical - YouTube
8. These videos may help you:
Performing Random Vibration Analysis Using Ansys Mechanical - YouTube
Performing Modal Analysis in Ansys Mechanical - YouTube
Regards Sheldon
Viewing 4 reply threads- The topic ‘Questions regarding Modal Analysis and Random Vibration Analysis’ is closed to new replies.
Innovation SpaceTrending discussionsTop Contributors-
4858
-
1587
-
1386
-
1242
-
1021
Top Rated Tags© 2026 Copyright ANSYS, Inc. All rights reserved.
Ansys does not support the usage of unauthorized Ansys software. Please visit www.ansys.com to obtain an official distribution.
-
The Ansys Learning Forum is a public forum. You are prohibited from providing (i) information that is confidential to You, your employer, or any third party, (ii) Personal Data or individually identifiable health information, (iii) any information that is U.S. Government Classified, Controlled Unclassified Information, International Traffic in Arms Regulators (ITAR) or Export Administration Regulators (EAR) controlled or otherwise have been determined by the United States Government or by a foreign government to require protection against unauthorized disclosure for reasons of national security, or (iv) topics or information restricted by the People's Republic of China data protection and privacy laws.


