
TAGGED: custom-field-function, udf-fluent, xy-plot
-
-
May 4, 2022 at 9:28 pm
imgenius07
SubscriberHi,i need to plot a graph between normalized tangential velocity and normalized radius for flow in a cyclinder of radius 2.54 cm. I have ten lines from centre to wall on which i have to plot tangential velocity. i have to normalize each line using tangential velocity on the same line at wall i.e.,
May 5, 2022 at 10:13 amRob
Forum ModeratorYou can use CFFs. Plot each CFF separately and then export to Excel. Alternatively, it's possible to read the line plots back into Fluent to plot there: Fluent predates Excel.
May 5, 2022 at 10:21 amSubscriberPlz help me just to make this expression. I cannot use excel due to some limitations and honestly i couldn't understand the alternative u told.
The thing is that i need to make an expression depending on y coordinate as x and z are constants ..
Tangential velocity is available in velocity menu but it'll not give one constant value for each line while i need a constant value for each line for normalization. So i will set coordinates to get that particular value for normalization.
Can u plz guide me in a little detail.
May 5, 2022 at 12:30 pmForum ModeratorOK, break the problem down. Not being able to use Excel may be a problem, but there's also OpenOffice and LaTeX if you don't have a licence.
Extracting tangential velocity with y-coordinate on a line in Fluent using an xy plot gets you the bulk of the data. The last point of the line may be the wall so that's that sorted. If you write out the plot you'll get a text file. This can either be used in Excel or you can also read xy plot files back into the Fluent xy plot panel.
May 5, 2022 at 12:40 pmForum ModeratorTo add. Once you've written out the files you can read them in again via the Load option. Note, manipulating the data may need a Custom Field Function or (easier) Excel or the like.
May 5, 2022 at 1:00 pmSubscriberyes i appreciate the answer, but plz try to understand that i have to get the plot in ansys i cannot use anything else so if you can kindly guide me that how to get the plot in fluent.
i have ten lines so i will have ten values for different y coordinates of each line .. i.e., i will have one value for each line and that value will be used to normalize that one line. then i will normalize all the 10 lines with their individual values and have them plotted on a single graph.
so i think an expression tangential velocity at (1,y,1) can solve the situation. for each line drawn the y has one value so there won't be a bulk of data . we will get a single value for each line .. i want it to be a function so that it can adjust itself as i will have total 10 lines and thus 10 different y values. x and z coordinates are same for whole problem so thats not a problem.
so kindly guide me how can i enter this
tangential velocity at (1,y,1)
in expression. i get the tangential velocity under the velocity tab but i don't understand how i can fix the coordinates.
May 5, 2022 at 1:23 pmForum ModeratorPlotting expressions isn't available at present. So, you will need a Custom Field Function of tangential velocity / constant for each position. There is no function to do this automatically as we tend to want raw data from Fluent: if you want to manipulate data it's done externally. The xy files are human readable so in theory you can use a calculator & text editor.
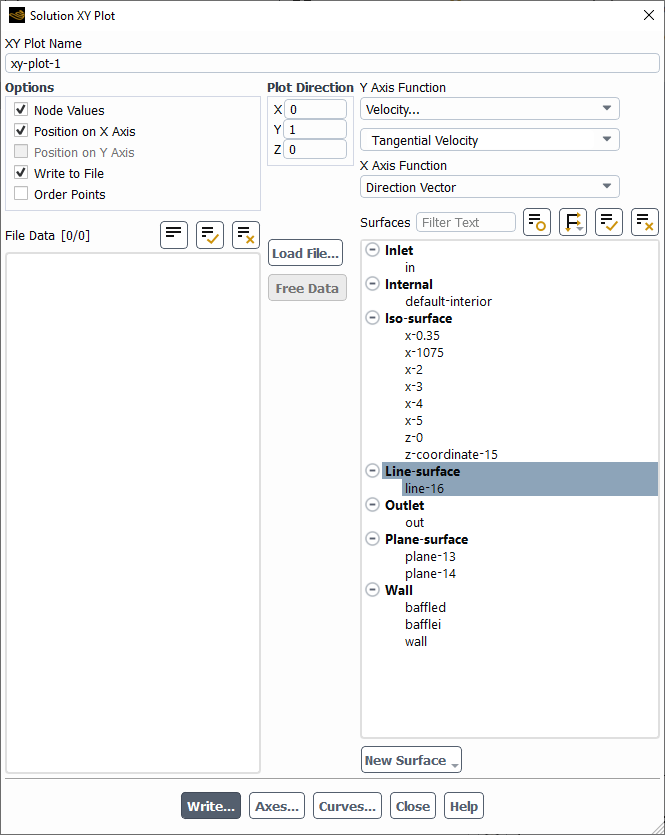
In Fluent, if you open the panel I posted you can create a plot. When you create the plot you pick a line/surface, this is something you create using Display-Surface-New choose line and follow the prompts in the panel. You'll need 10 of these. You can write out the plot (the text file) and once you have a few you can also Load those files back in to plot.
If you click on Help you'll find tutorials. I think the NACA airfoils use xy plots on the wing surfaces and that'll give you a starting point.
May 5, 2022 at 2:03 pmSubscriberAlright thank you so much .. it was really helpful .. i think i will now use exported data to plot externally using excel etc ..
Just one last question.
In report definition, we can define an expression. The tangential velocity is available under velocity tab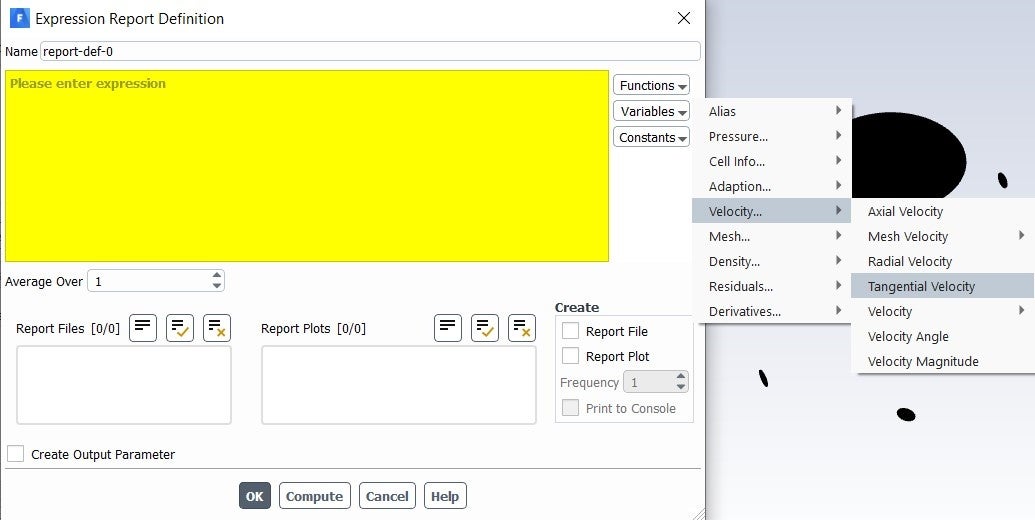 i want to define an expression that says
Tangential Velocity at coordinates (1 ,y ,1)
Is this possible. If Yes then how ....
Thanks in anticipation
May 5, 2022 at 2:50 pmForum ModeratorYou don't. You plot the report at a position using a surface as I mentioned. In your case it'll be a line from the axis to the wall: the XY Plot image is what you're replicating.
Viewing 8 reply threads- The topic ‘imgenius07’ is closed to new replies.
Ansys Innovation Space Trending discussions
 Top Contributors
-
peteroznewman
 3862
3862 -
scabo
 1414
1414 -
Dennis Chen
 1221
1221 -
javat33489
 1118
1118 -
Shyam Prasad V Atri
1015
Top Rated Tags
© 2025 Copyright ANSYS, Inc. All rights reserved.
Ansys does not support the usage of unauthorized Ansys software. Please visit www.ansys.com to obtain an official distribution.
-


The Ansys Learning Forum is a public forum. You are prohibited from providing (i) information that is confidential to You, your employer, or any third party, (ii) Personal Data or individually identifiable health information, (iii) any information that is U.S. Government Classified, Controlled Unclassified Information, International Traffic in Arms Regulators (ITAR) or Export Administration Regulators (EAR) controlled or otherwise have been determined by the United States Government or by a foreign government to require protection against unauthorized disclosure for reasons of national security, or (iv) topics or information restricted by the People's Republic of China data protection and privacy laws.


