

TAGGED: coaxial-waveguide
-
-
February 21, 2022 at 7:12 am
Bandi
SubscriberHi everyone,
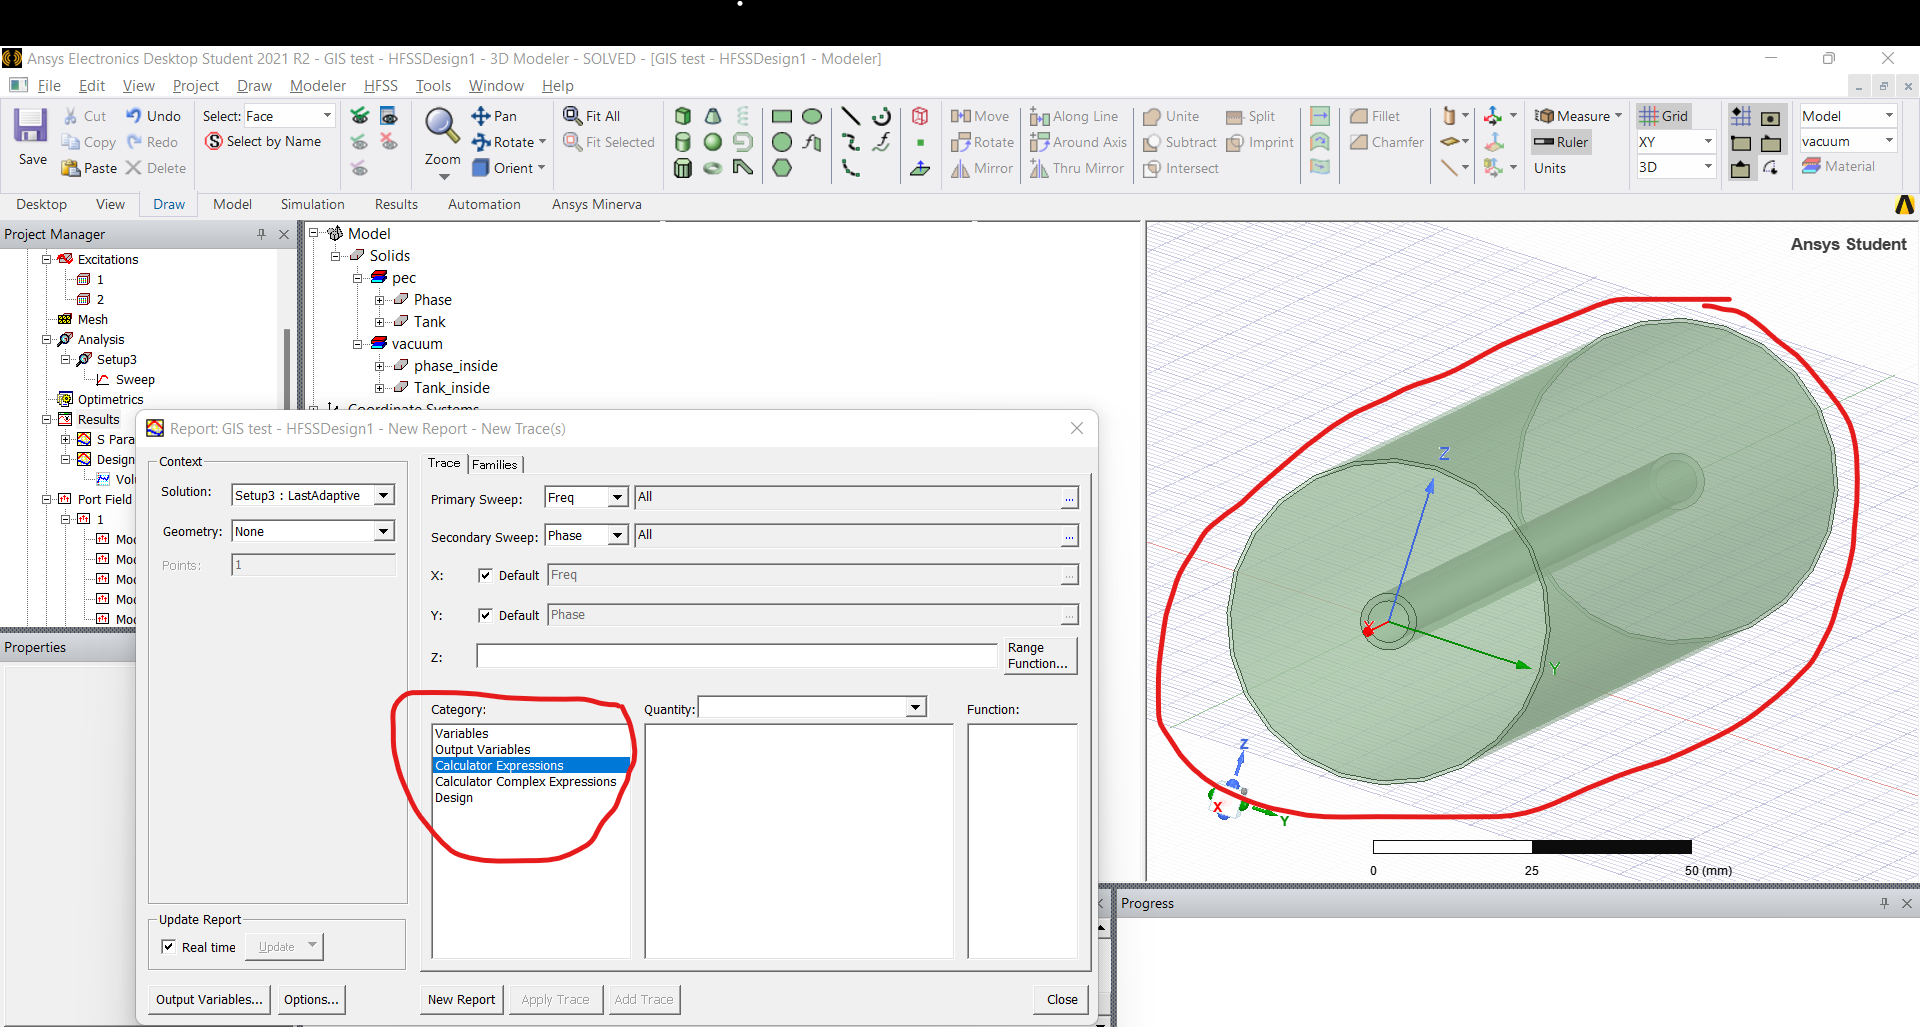
I would like to make the contour plot (Electric field of the circumference of the outer conductor, Frequency, and Phase) of the coaxial waveguide.
I thought I can see the changing of TE modes from this graph. But, I could not add the magnitude of the Electric field in quantity.
What should I do to make this contour plot?
Thank you for your time.
February 22, 2022 at 12:03 pmChinmay T
Forum Moderator
To plot the electric field after you have completed the analysis - first, you have to select the object for which you want to see the contour plot.
After selecting the object, Go to "HFSS -> Fields -> Plot Fields -> select field quantity you want to plot".
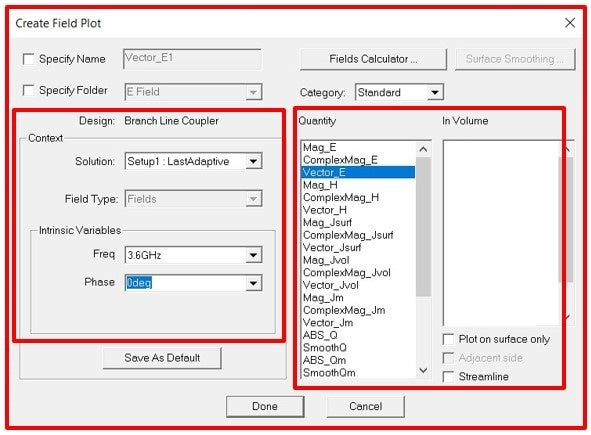
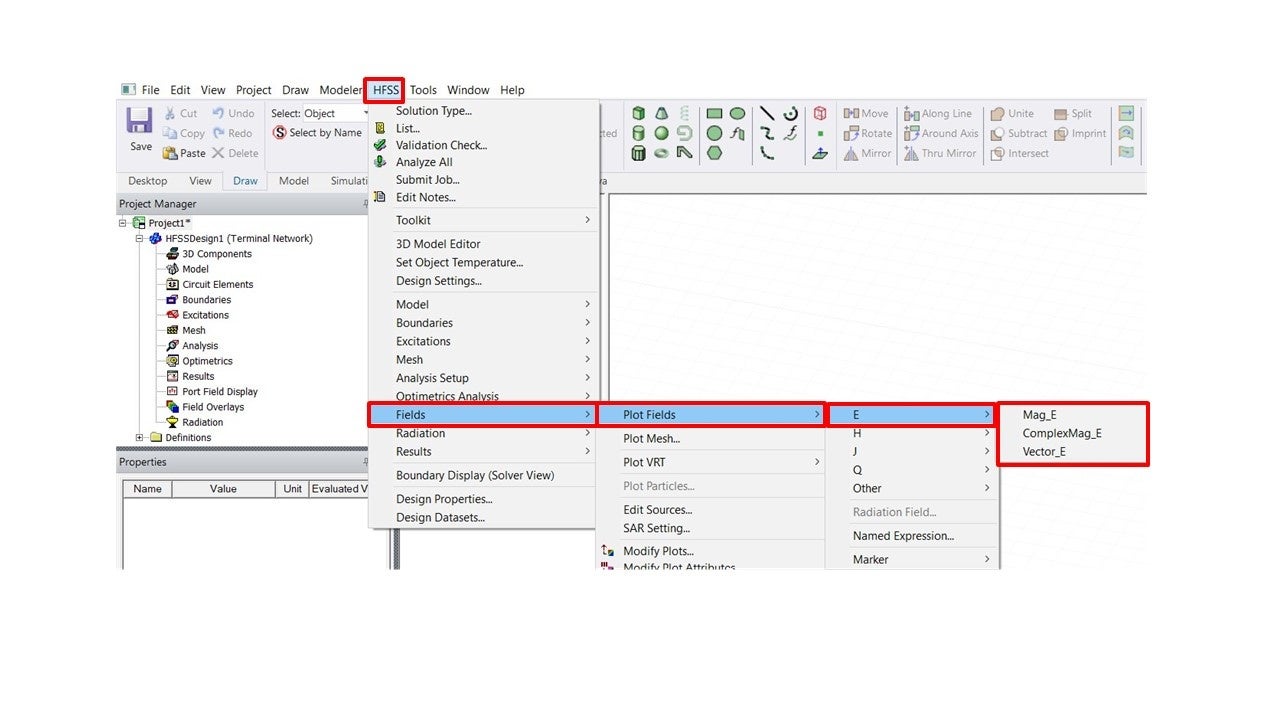 After selecting field quantity new create field plot window pops up, In this window, you have to select different fields like solution type, frequency, phase, quantity, etc.
on the bottom right side of this window, you can check the streamline box to indicate magnetic flux lines (Make sure that for plotting the streamline plot you select the vector quantity)
and when you modify the settings, click Done to view the plot.
Please go through the "Plotting Field Overlays" and "Notes for creating Streamline plots" section from HFSS Help document for more details.
or you can also watch "Intro to Ansys HFSS" video playlist :
https://www.youtube.com/watch?v=CXcIqkt72G8&list=PLtt6-ZgUFmMIDnxrk-Xi4K8R--6D4h95G&index=23
Thanks Chinmay
February 24, 2022 at 5:04 amSubscriberHi @ctelkikar Thank you for your kind support.
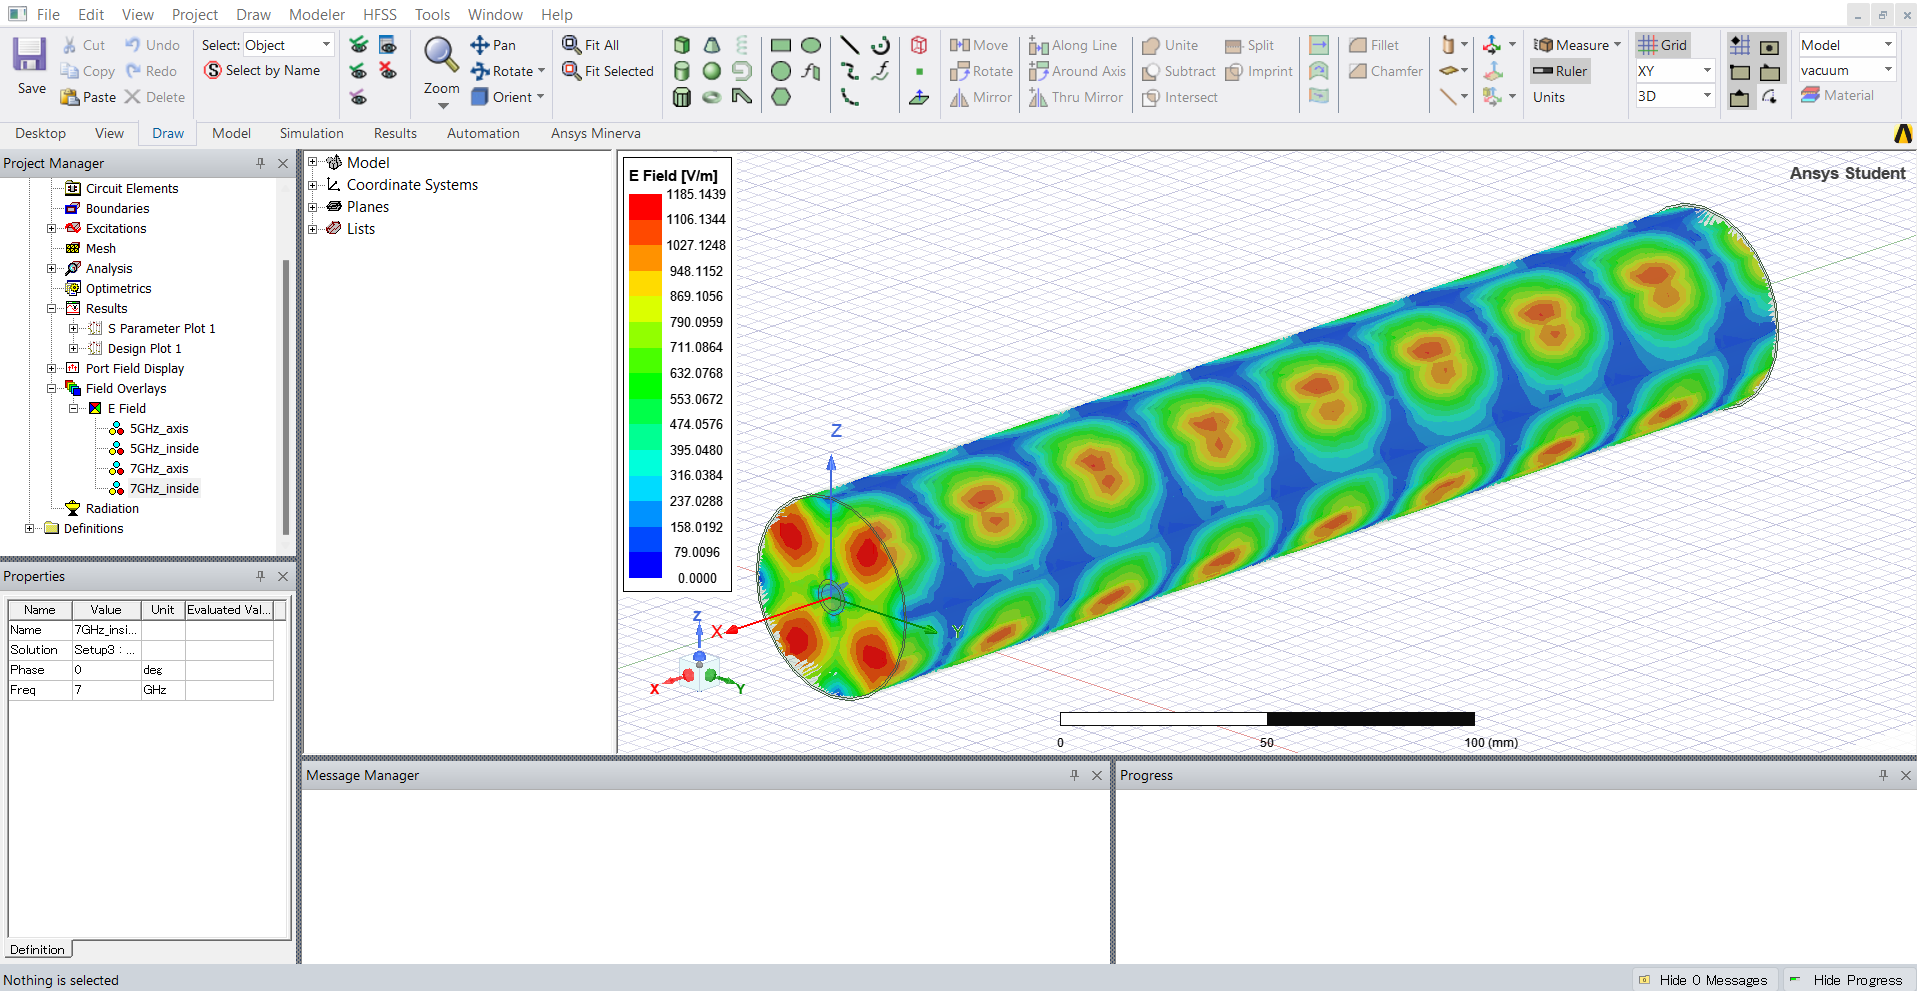
I have already made the electric field distribution in the volume of the outside cylinder as shown in Fig.1.
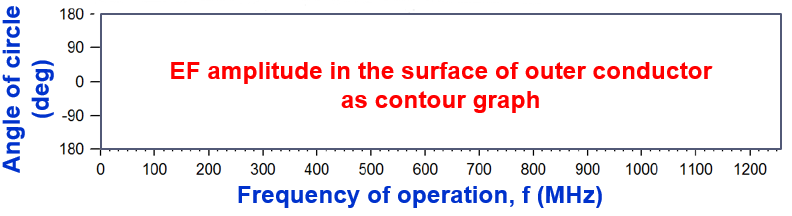
 However, I would like to build the EF distribution in the inside surface of the outside cylinder depending on frequency (or depending on cylinders length) as shown in Fig.2.
 I am just a beginner at this software. So, I don't know whether it is possible to make this contour graph or not.
I could not find the function for this type of graph.
Do you have any idea about this? if yes, please let me know.
Thank youViewing 2 reply threads- The topic ‘How to make contour plot (EF, frequency and phase) in coaxial waveguide?’ is closed to new replies.
Ansys Innovation Space Trending discussions
- Y wiring method and the start and end points of winding.
- Lumped Port Deembed
- Optimizing Via Impedance in Ansys HFSS 3D Layout Using Geometric Parameter Sweep
- Hfss 3D pcb via capped and filled with epoxy
- AEDT Natural Convection with default correlation is failing solver initializatio
- HFSS libnvidia-ml.so too old or could not be found – Warning in slurm job output
- Three-Phase Voltage Imbalances in dual stator electric generator
- STL Import Errors in HFSS After Cleaning in SpaceClaim
- Calc Error in Field Calculator after PyAEDT Analyze
- import file autocad 3d
Top Contributors
-
peteroznewman
 3892
3892 -
scabo
 1414
1414 -
Dennis Chen
 1241
1241 -
javat33489
 1118
1118 -
Shyam Prasad V Atri
1015
Top Rated Tags
© 2025 Copyright ANSYS, Inc. All rights reserved.
Ansys does not support the usage of unauthorized Ansys software. Please visit www.ansys.com to obtain an official distribution.
-


The Ansys Learning Forum is a public forum. You are prohibited from providing (i) information that is confidential to You, your employer, or any third party, (ii) Personal Data or individually identifiable health information, (iii) any information that is U.S. Government Classified, Controlled Unclassified Information, International Traffic in Arms Regulators (ITAR) or Export Administration Regulators (EAR) controlled or otherwise have been determined by the United States Government or by a foreign government to require protection against unauthorized disclosure for reasons of national security, or (iv) topics or information restricted by the People's Republic of China data protection and privacy laws.


