-
-
January 17, 2022 at 1:17 pm
a.zozulia
SubscriberHello,
I am trying to design a sidewall grating with a specific coupling constant. For gratings with top etching, normally I can run a MODE solver simulation to obtain effective indexes for 2 different cross-sections of the grating and then do an analytical calculation, where a coupling constant is related to n_eff by simple formula. Then I simulate the reflectivity spectrum using transfer matrix method and I double check it with EME and FDTD solver (FDTD is possible), and they all give me quite similar results.
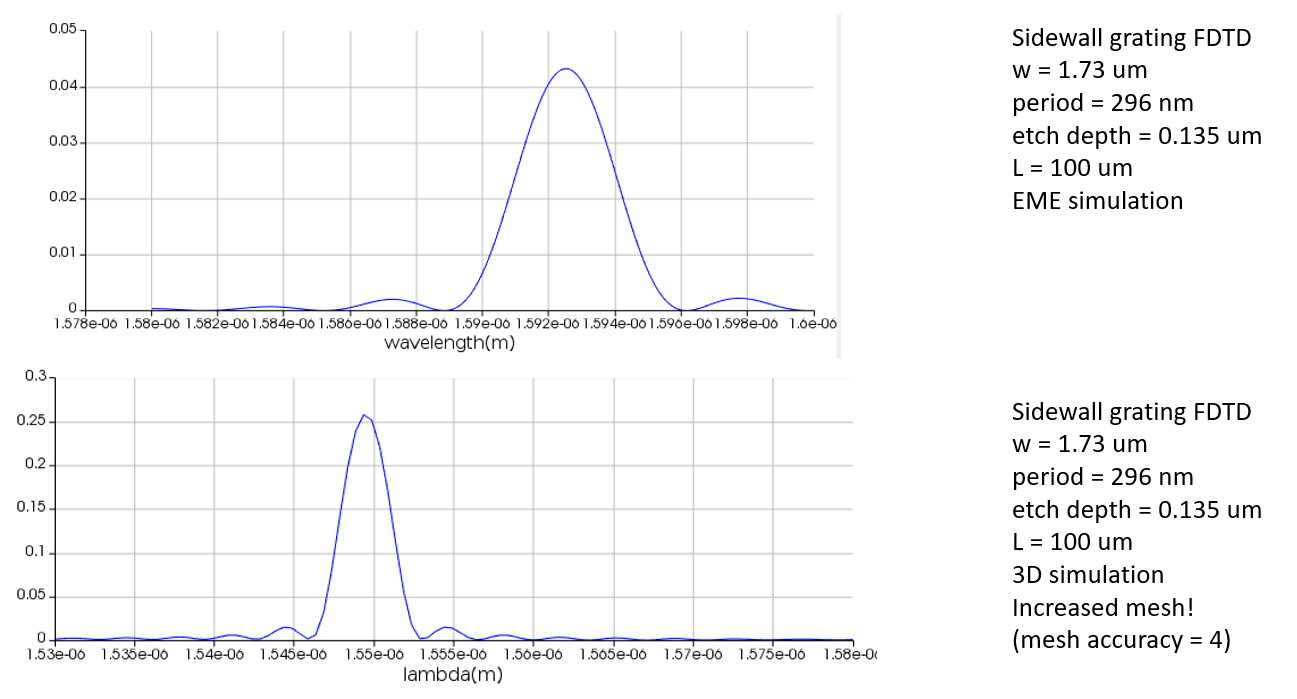
With sidewall grating, however, it was not the case. I observe that my EME simulation gives a very different result from 3D FDTD, in terms that reflectivity in EME is much lower and the peak is located at different wavelength, and also there is a general significant drop of transmission. 3D FDTD simulation gives a result similar to transfer matrix calculation, but for slightly different period, but this can be attributed to different mesh settings. But I don't like to use FDTD for this structure because the simulation time is very long even for a relatively coarse mesh.
January 18, 2022 at 12:34 amGuilin Sun
Ansys EmployeeThis is a very interesting question. Unfortunately Ansys employees are not allowed to download customer files in this forum.
In general, they solve different Maxwell Equations: FDTD directly solve the Curl equations and the continuity is guaranteed in nature (material interface excluded for this discussion) by its genius design of the algorithm: leap-frog marching in time domain and interlaved in space. Yee's FDTD is 2nd order accurate in both time and space. EME, on the other hand, solves the continuity equations: the tangential fields are continuous. FDTD is a time domain method whereas EME is a frequency-domain method.
Therefore, their sources of errors are different.
Assuming the geometry is the exactly same in both cases after meshing. One thing you need to check first is the material: FDTD uses a fitted refractive index. In EME, if you do not check, it is not fitted. and its fitting might be different from FDTD. I would suggest to get fdtd fitted refractive index and import to EME. then in EME you do not need to fit. In addition, their mesh may be different.
Make sure the source mode is the same.
For resonance, FDTD needs sufficient time for signals traveling back and forth to accumulate the strength, and its resonant wavelength can be mesh accuracy dependent; EME has built-in forward-backward propagation mechanism, and if all other settings are proper, its resonance is weekly dependent on mesh size.
In FDTD, all the higher order modes excited will be counted in physics, whereas in EME, you have to include all of them. Loss of any excited modes can lead to errors. Of course this depends on the relative contribution of the individual modes to the overall fields. In EME it can be difficult to include all the modes. In addition, the existence of non-excited modes may spoil the result. But it is difficult to choose only the necessary modes. Usually you can try to use a large number of modes and then do a mode convergence sweep.
EME has different groups with different number of cells. If their settings are not proper, the result may be not accurate. For a section with uniform physical cross section (counting the refractive index) only one cell is enough. Otherwise you may need more cells or more groups.
I guess you use the built-in wavelength sweep (it reuses the same mode properties at the calculated wavelength). It works fine for less dispersive waveguide. if the dispersion is large or group refractive index changes fast, This method can lead to some errors.
We can list more differences.
In short, they are different algorithms and have different sources of errors. It can be challenging to directly comparing their result accuracy without considering all dominant factors that affect the accuracy. and I could not give a conclusion which one is better, without tackling those and other issues.
.
January 18, 2022 at 6:05 pma.zozulia
SubscriberThanks a lot for your response.
It is very unfortunate that you cannot download customer files in this forum. Previously this was possible...
Regarding your answers: could you please explain in more details, how do I import fitted material data from FDTD into EME?
Also, you mentioned that built-in wavelength sweep might not be reliable in EME; is there a way to do it differently then, to account for higher dispersion? Or EME becomes generally not well-suited for this kind of structures? But I don't think this is the case for my structure. Group index is 3.471 vs 3.481 in 2 different cross-sections.
I found the error related to low strength of resonance in EME: I needed to put energy conservation to "conserve energy" mode. Right now the resonance looks closer to what I expected. But the resonant wavelength is very different from FDTD, and still much weaker than in FDTD for the same geometry (but now at least reflection increases with increased corrugation depth or increased length). I assume the material might be the source of the problem.
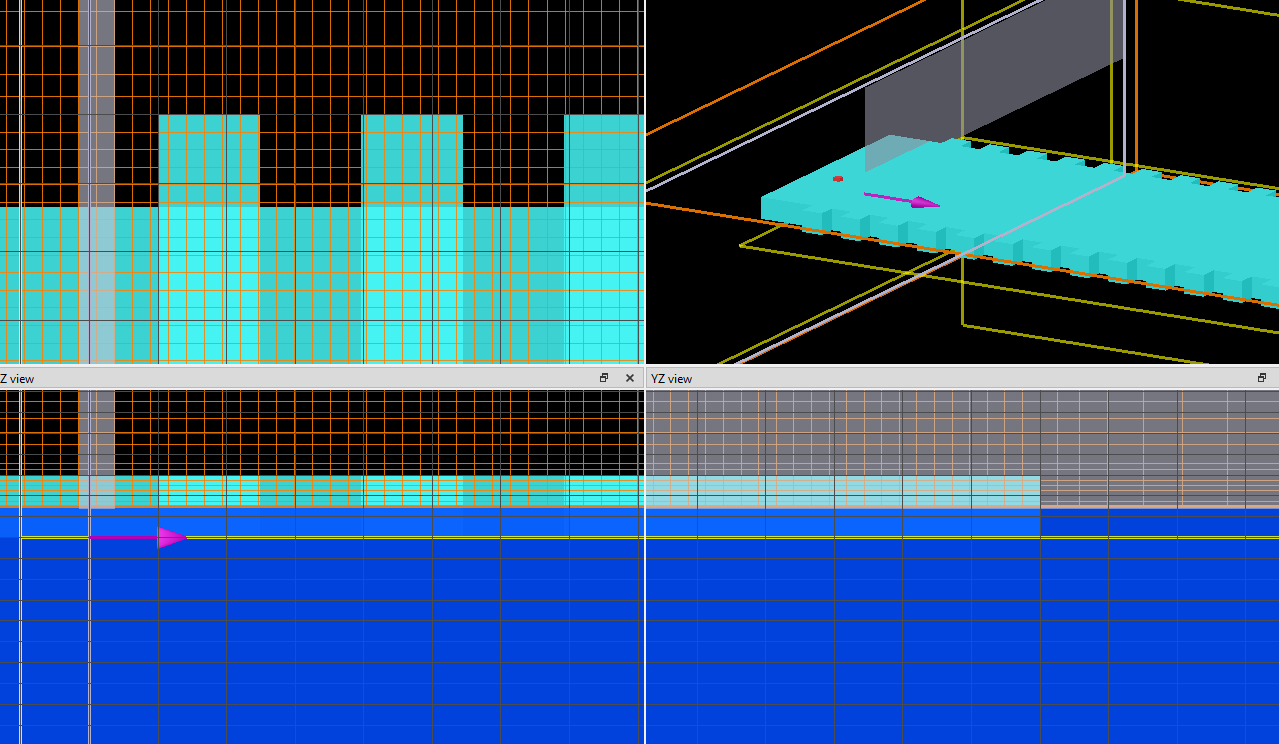
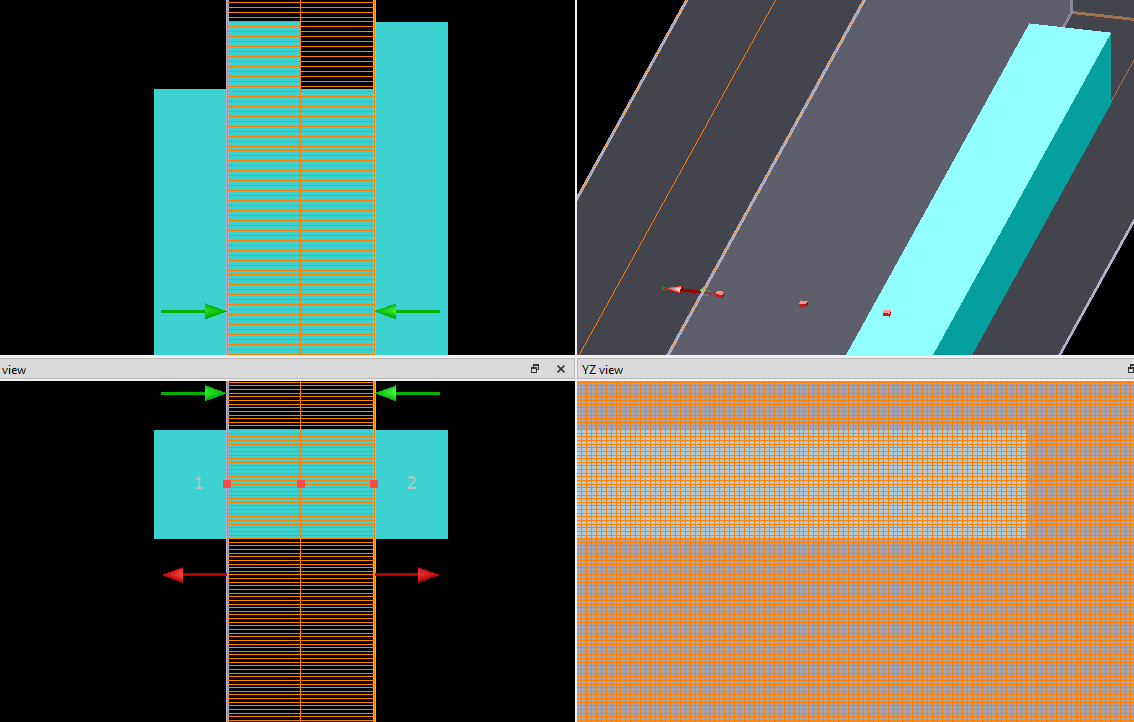
The rest of the things you mentioned I checked and I think it's fine: I am using relatively high mesh accuracy in FDTD (auto-nonuniform, accuracy 4, conformal variant 0), same source mode, in EME I did mode convergence and I am using big enough number of modes, cell settings should also be fine, as there are only 2 constant cross-sections, so I am using 1 cell per cross-section.
Mesh in my FDTD:
 Cells in my EME:
 The results I get in FDTD vs results I get in EME:
January 18, 2022 at 10:37 pmGuilin Sun
Ansys Employee"It is very unfortunate that you cannot download customer files in this forum. Previously this was possible..."
It is Ansys policy.
"how do I import fitted material data from FDTD into EME?"
Please refer this article: Creating new sampled data materials in FDTD It is the same for FDTD and MODE. I suppose you can get the fitted data from FDTD.
"Also, you mentioned that built-in wavelength sweep might not be reliable in EME;" I did not say generallyit is not reliable. All depend on the mode dispersion, and the effort you make. Many a time there is a trade off between simulation accuracy and simulation time.
If your waveguide has larger dispersion (whether it is larger or smaller, depends on the accuracy you desire), to get accurate result, you will need to sweep wavelength for EME and recalculates all the modes, which is time consuming. Or you can divided the spectra to several ranges so do the simple sweeps and then recombine them to the final results. In most cases, a waveguide device works for very narrow band. Then the built-in wavelength sweep is the best choice. In your case, I am not sure if it is due to this effect. But I just describe the difference between the two algorithms.
From your screenshots, I do not believe that FDTD is more accurate, as you can see, the mesh for the grating teeth is not periodic! you could use override mesh with integer number of meshes per period to maintain its periodicity discretely. In EME it is forced to be periodic.
If a structure has many periods, "conserve energy" is the recommended setting. and you could compare the results with other options.
From the screenshots, it is obvious that EME uses finer mesh for the gratings than FDTD. Again, EME depends less on the mesh size than FDTD.
January 28, 2022 at 12:56 pma.zozulia
SubscriberHi Gsun Thanks a lot for your previous comment.
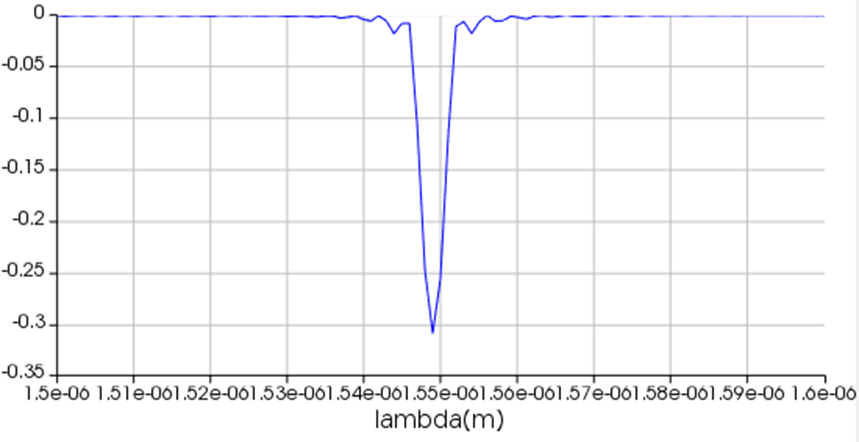
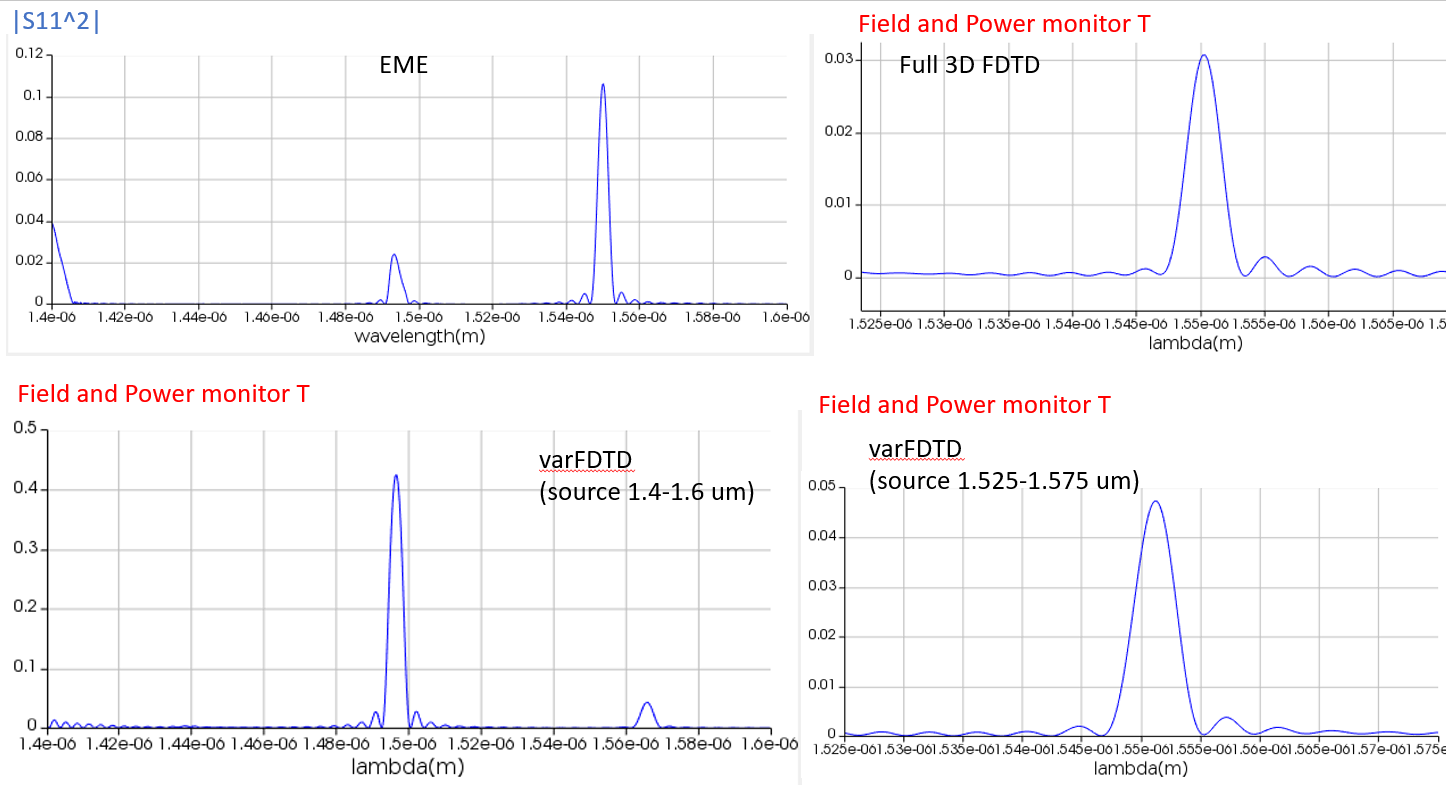
I fixed a few things that you pointed out in the simulation. Now the reflection seems to occur at the wavelength of design, which is good, but what I am worried about, is the peak reflectivity value. In EME it's more than 0.1, in varFDTD it's 0.047 and in 3D FDTD it's 0.031 for the same geometry. This is quite an important design parameter. Could you give some suggestions what leads to such a discrepancy and which of the methods gives a more reliable value? I think it might have to do with the source settings in FDTD, and that the power is distributed along a range of wavelengths?
I am comparing |S11^2| from EME, generated with built-in wavelength sweep, and result T from the field and power monitor in FDTD (the monitor is placed behind the source and collects the reflection).
 My FDTD setting:

January 28, 2022 at 5:35 pmGuilin Sun
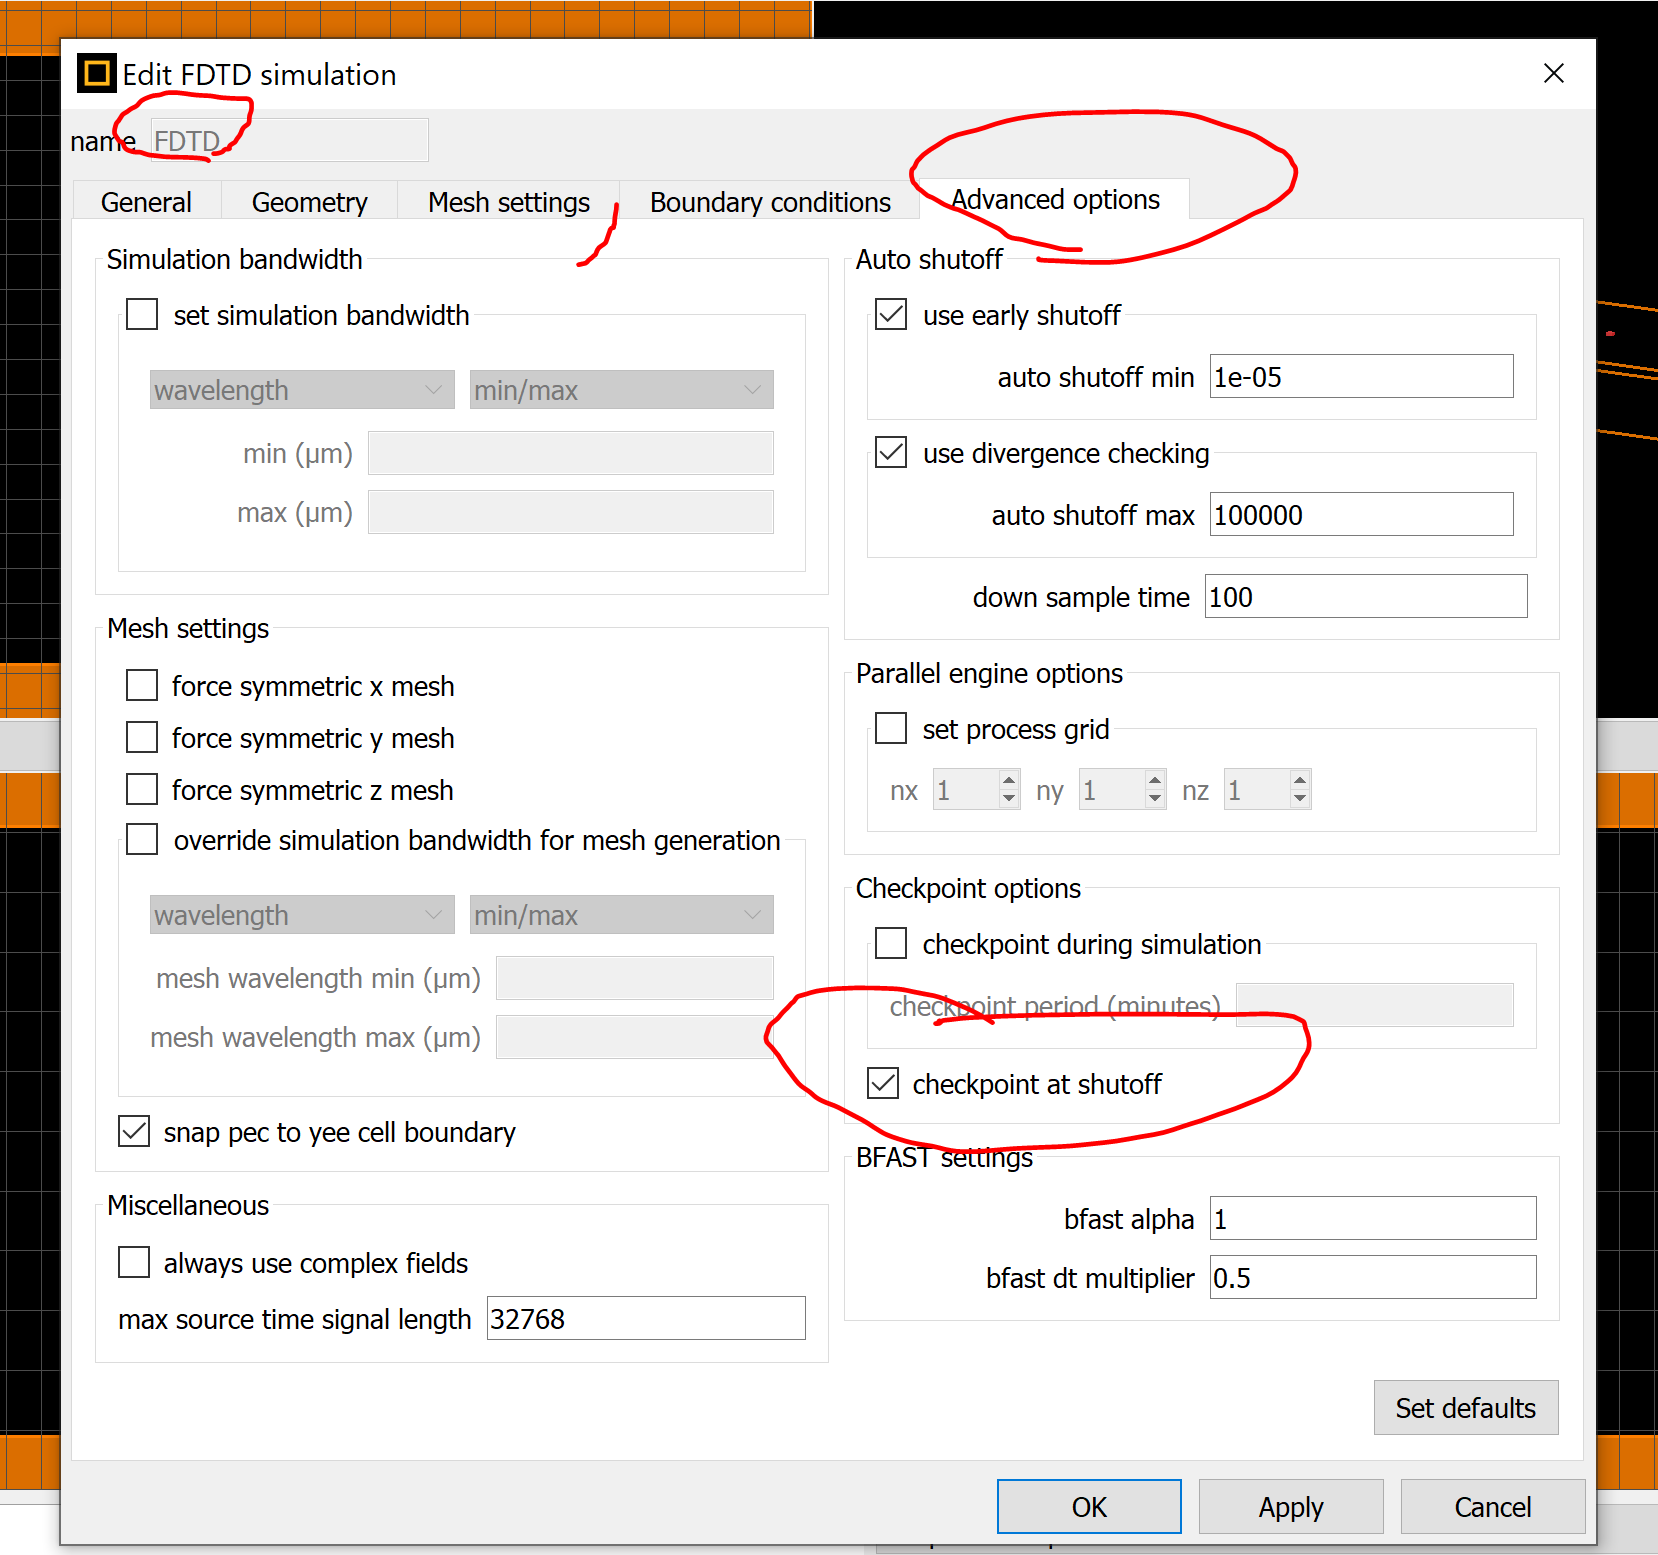
Ansys EmployeeIt is grating structure so the back-and-forth reflection is strong. in time domain method, you will need to set sufficient simulation time to let the intensity to accumulate, therefore you will also need to significantly reduce autoshutoff min.
From the results at 1.525~1.575um it indicates that the simulation time is not long enough, so the Fourier transform has ripples. so please increase simulation time and reduce autoshutoff min. You can set long enough simulation time, and set "check points" so you can compare results at different autoshutoff min:

February 2, 2022 at 5:49 pma.zozulia
SubscriberHi Gsun, thanks a lot for your last comment. I tried to use your advice. I reduced auto shutoff in varFDTD from 1e-5 to 1e-7, then to 1e-10 and then I disabled it completely and ran the full simulation time (which was 20000 fs). The result was completely the same as with 1e-5 autoshutoff. I don't even attach pictures, as I did not notice any difference. In 3D FDTD I tried to reduce it to 1e-7 and also did not notice any difference. It also can be confirmed by checking a transmission monitor in the end of the structure, the transmitted and reflected power nicely add up to 1, there is an error on the order of of 0.1%, but difference between peak reflectivity in EME and 3D FDTD is almost 10%.
I think the ripples in the Fourier transform are not because the simulation time is not long enough, but because it's normal for periodic structures to have weak side-lobes around the strong main lobe in their reflectivity spectrum.
Having said that, I am still not sure which result is more reliable and should be taken as a basis for design of such a structure.
February 2, 2022 at 11:38 pmGuilin Sun
Ansys EmployeeBoth EME and FDTD are reliable as long as you have properly set all simulation parameters. I would suggest that you do self comparison within one tool, and check the R+T for the total transmission and reflection. As previously mentioned, all computation methods have their own sources of errors. please refer this post: Ansys Insight: Why my simulation result is different from published paper or experiment?
please exclude the PML reflection, and carefully check all the settings, including meshing, PML, distance to PML, number of cells and modes for EME etc.
I would say it can be challenge in some cases to make two different tools having the same result. You may refer the papers from the above link.
February 3, 2022 at 12:30 amGuilin Sun
Ansys EmployeeThis paper uses both tools for their design: Fiber-chip edge coupler with large mode size for silicon photonic wire waveguides, Vol. 24, No. 5 | DOI:10.1364/OE.24.005026 | OPTICS EXPRESS
AS you can see, as far as the settings for the two are proper, their results agree well. So it is not the question of which tool is more liable than the other, it is the settings that need to be proper. There are a lot to be done to get well agreed result. Please refer the convergence testing:
Convergence testing process for FDTD simulations
EME Convergence Testing - An Intuitive Approach
Convergence testing process for EME simulations
It needs time, well understanding of the dominator factors and sources of error in order to set properly.
April 17, 2023 at 6:02 pmsme8
SubscriberI have a question regarding the coupling of a nanobeam photonic crystal resonator with a nearby bus waveguide using the side-coupled approach. Is it possible to use the EME solver in this case?
Furthermore, I am interested in measuring the quality factor in the transmission spectrum of the bus waveguide. The intrinsic quality factor of the resonator is over 1 million, so I'm wondering which solver would work better for this scenario: FDTD or EME?
April 17, 2023 at 9:23 pmGuilin Sun
Ansys EmployeePlease write a new post as this question is different from the original post. Always write a new post whenever you have questions different from the forum post. In this way, people can easily find the solution with the same or similar questions.
Viewing 10 reply threads- The topic ‘Difference in results between FDTD and EME’ is closed to new replies.
Innovation SpaceTrending discussionsTop Contributors-
4858
-
1587
-
1386
-
1242
-
1021
Top Rated Tags© 2026 Copyright ANSYS, Inc. All rights reserved.
Ansys does not support the usage of unauthorized Ansys software. Please visit www.ansys.com to obtain an official distribution.
-


Ansys Assistant

Welcome to Ansys Assistant!
An AI-based virtual assistant for active Ansys Academic Customers. Please login using your university issued email address.
Hey there, you are quite inquisitive! You have hit your hourly question limit. Please retry after '10' minutes. For questions, please reach out to ansyslearn@ansys.com.
RETRY
