-
-
September 7, 2021 at 3:07 am
ISSAMAZERTY
SubscriberI did a tensile test in a static structural :
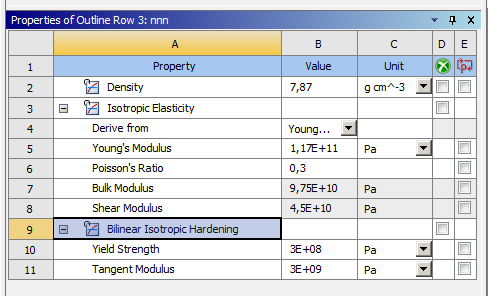
I defined the substance (young modulus, Poisson's ratio, multilinear stress-strain curve).
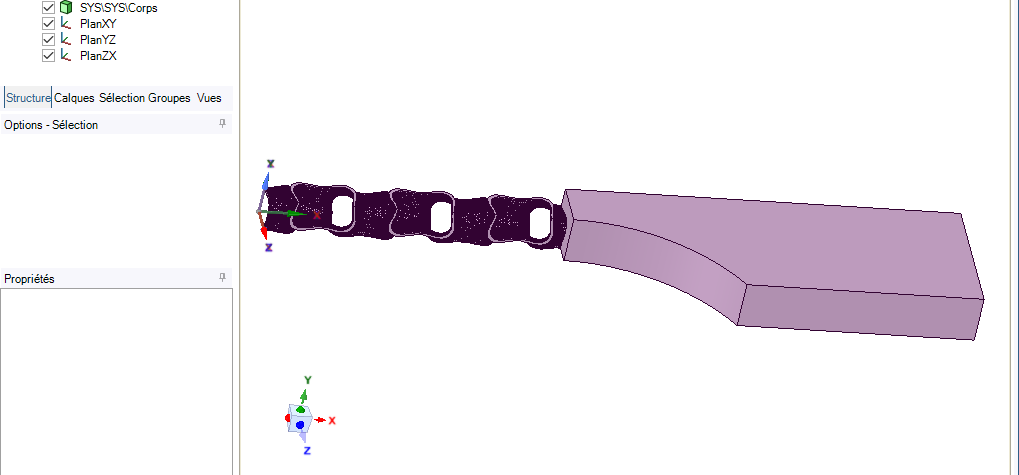
For the structure, I used the lattice structure.
The problem with the results, when extracting the curve stress-strain keeps the same values of the material you entered earlier. In the sense that it does not take into account the impact of the structure.
September 7, 2021 at 12:31 pmpeteroznewman
SubscriberYou input a material Stress-Strain curve into a model that has the geometry in a lattice structure and when you plot material Stress-Strain results, you get back the input, is that what you are saying?
Say your Lattice Structure is 80% void and 20% material, you might expect that the Effective Stress vs Strain curve would be reduced to about 20% of the material stress value.
To measure this, you can't plot the material Stress value, you have to request the Tension Force and divide by the Area of the cross section (counting both the void and the material) to get the Effective Stress.
September 8, 2021 at 4:36 amISSAMAZERTY
SubscriberThank you so much for your answer.
I got the right results.
September 8, 2021 at 10:10 amSeptember 9, 2021 at 5:42 amISSAMAZERTY
Subscriber
Also in the experimental data file, when I extract the cross-sectional area, I find that it changes with the change in the applied force.
Will it be variable when I need to calculate stress?
September 9, 2021 at 12:45 pmpeteroznewman
SubscriberThe definition of Engineering Stress is Force/Initial Cross-Sectional Area. In a tensile test of a solid material, the cross-sectional area changes with applied force.
There is another definition for True Stress, which accounts for the change in cross-sectional area so the True Stress is higher than the Engineering Stress after some plastic strain has built up.
You say you got a high-value stress, compared to what?
How exactly did you calculate the cross-sectional area?
For what reason are you calculating stress?
I suggest you use the Force-Displacement data to characterize the structure. That is both easy to measure and meaningful.
September 9, 2021 at 1:00 pmISSAMAZERTY
SubscriberI have data to test the tensile test that was done.
I apply displacement to the structure and extract the value of the force as you told me, after that, I try to convert it into stress-strain values.
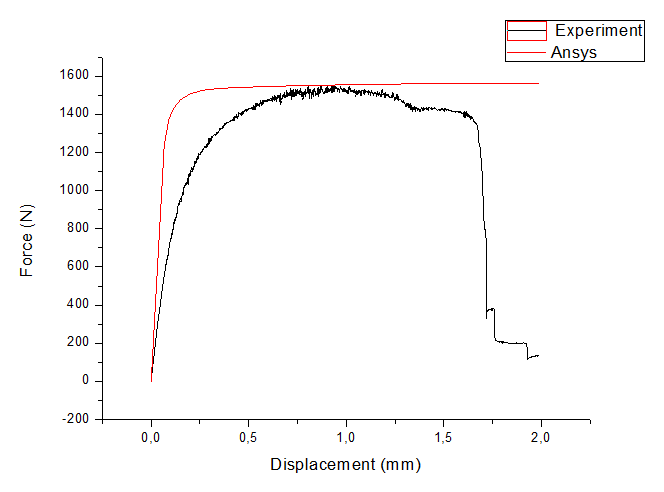
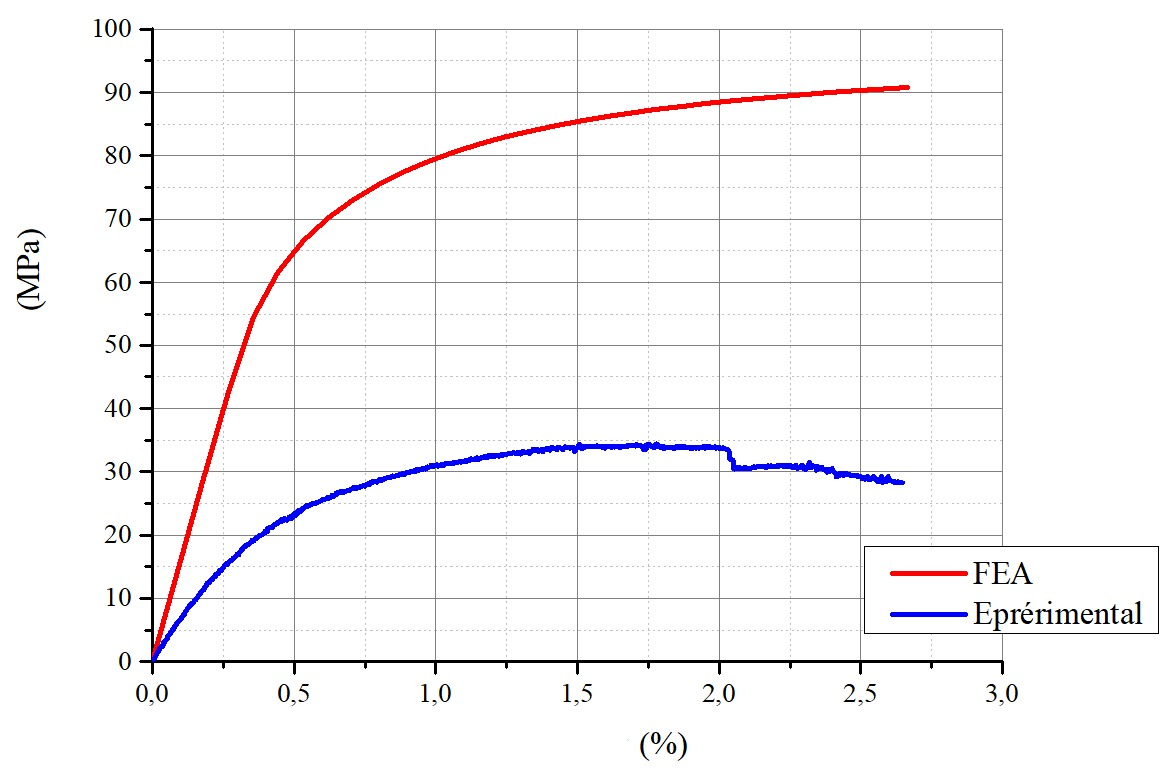
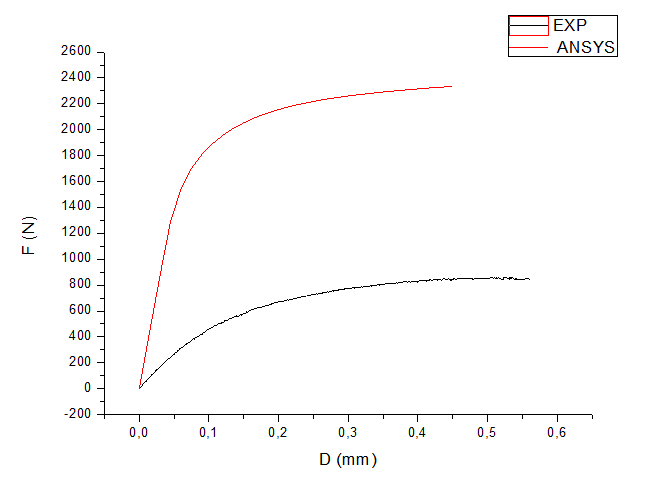
When I compare the experimental values with the Ansys values, I find that the simulation values are very large.
I want to know if the method I used is correct or I have another problem.
September 9, 2021 at 1:02 pmISSAMAZERTY
SubscriberI want to compare the stress-strain curve, between experimental and Ansys simulation
September 9, 2021 at 1:04 pmpeteroznewman
SubscriberYou mean you have experimental data to compare with the simulation? Good. Get the Force vs Displacement experimental data and overlay the simulation Force data. Show us that graph.
Don't try to convert your simulation data to stress-strain data.
Do you know how the experimental data was converted from Force to Stress? Find out the details, or just plot the force.
September 9, 2021 at 1:19 pmISSAMAZERTY
SubscriberI don't know how the experimental data was converted.
I only have stress-strain and displacement values, so I need this conversion.
September 9, 2021 at 1:24 pmISSAMAZERTY
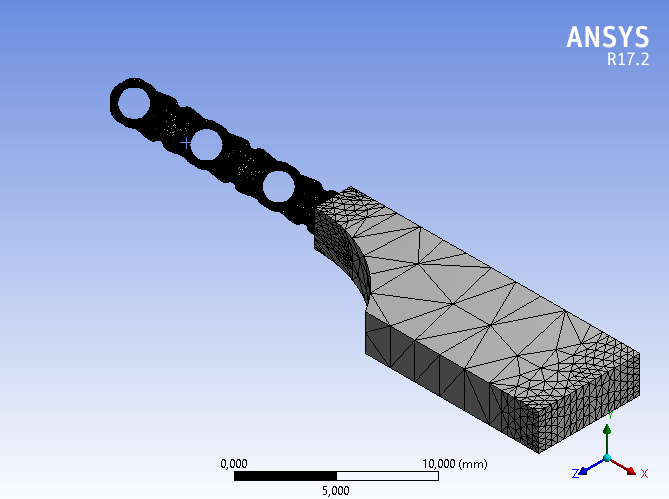
SubscriberWhen using symmetry in three directions, must the force be multiplied by 4 to find the correct value of the force?
September 9, 2021 at 7:37 pmpeteroznewman
SubscriberYes, multiply the force by 4 to get the total from a 1/4 symmetry model.
If you don't know how the experimentalists converted Force to Stress then you are completely in the dark.
You may as well take the Stress value they provided at a known Strain/Displacement and compute the value of area that turns your force into their stress, then you will get exactly the stress they show at least at that one point.
September 10, 2021 at 2:17 amISSAMAZERTY
SubscriberThank you so much for your answers.
I have one question left.
Is the displacement I should apply to the structure in the test is the same as the stroke value?
September 10, 2021 at 2:43 ampeteroznewman
SubscriberYes, stroke equals displacement.
September 10, 2021 at 8:36 amISSAMAZERTY
SubscriberThank you.
I did everything we mentioned, but I'm still getting large results compared to the experience.
I think the problem is elsewhere.
September 15, 2021 at 5:22 pmISSAMAZERTY
Subscriber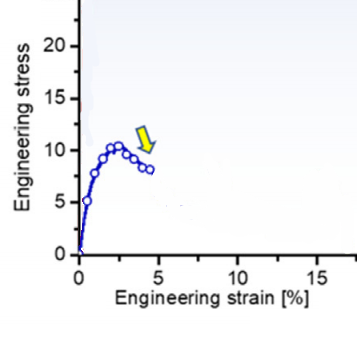 Hello Mr. Peter
Thank you for your useful answers.
I got good results. I had a problem with the mesh.
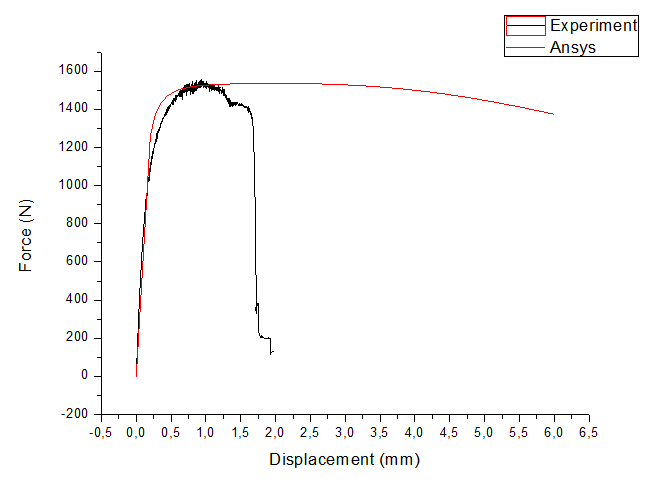
I have a question about comparing the experiment with simulations, when extracting the graph the stress increases with increasing the strain, it doesn't go down like the experiment.
Is there a property in the material that I must add to show the results, such as an experiment, or any other solution?
Thank you again.
September 15, 2021 at 9:54 pmpeteroznewman
SubscriberEngineering Stress is Force/Area.
An experiment records force and divides by the area. What area did they use?
You should plot the reaction force from your simulation and compare it with the force measured in the experiment. Then you don't care about area.
September 16, 2021 at 6:05 amISSAMAZERTY
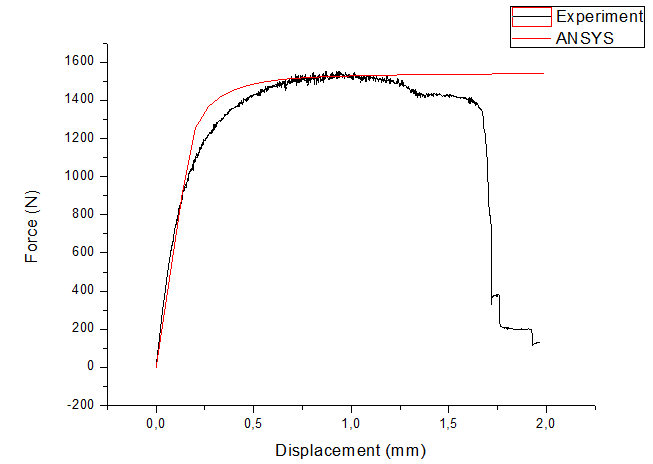
SubscriberIn the experiment when a large displacement is applied the force values begin to decrease until they are absent at refraction, the simulation reverses the larger the displacement, the higher the force value
Is there a way to show reaction force like an experiment?
September 20, 2021 at 5:06 pmISSAMAZERTY
SubscriberI would like to say how do I do tensile test to see necking ? (Tensile strength simulation model)
September 20, 2021 at 8:43 pmpeteroznewman
SubscriberIf you have plasticity in the material model, you can see necking occur in the simulation.
/forum/discussion/23145/why-doesnt-the-load-passes-through-max-shear-stress-direction-for-ductile-materials
September 20, 2021 at 9:52 pmSeptember 22, 2021 at 11:52 pmISSAMAZERTY
SubscriberSorry, can you explain to me more how to define plasticity in the material model?
September 23, 2021 at 12:01 amSeptember 23, 2021 at 2:17 ampeteroznewman
SubscriberYou have plasticity in the model. Bilinear Isotropic Hardening is one type of plasticity.
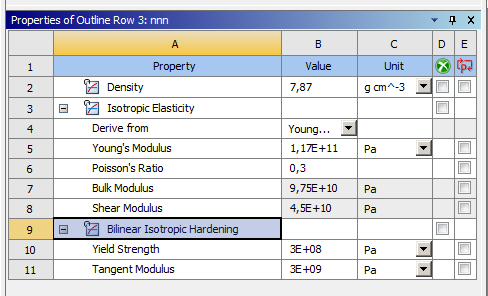 Try using 0 for the Tangent Modulus.
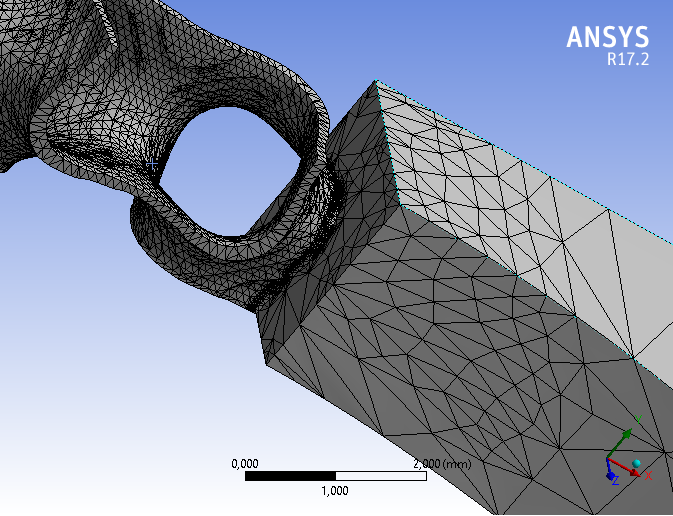
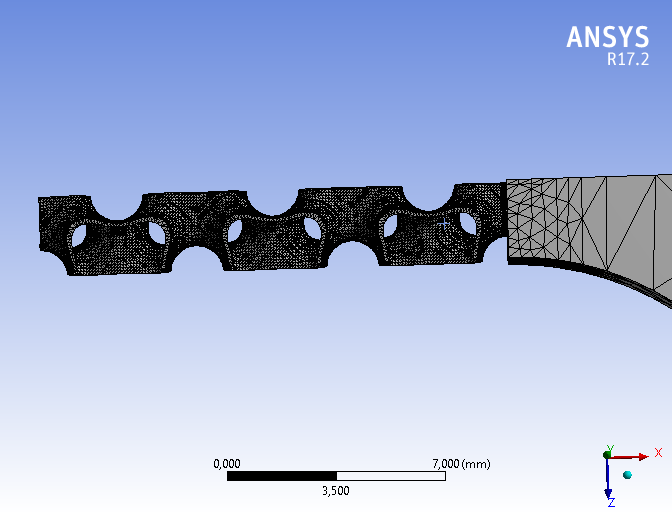
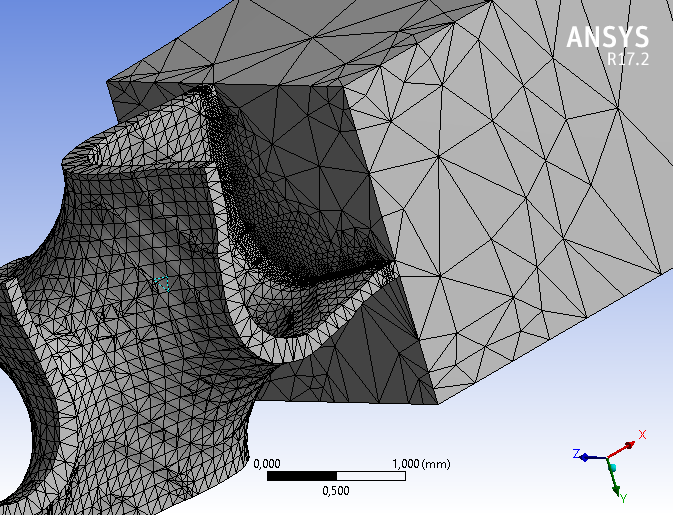
Another issue with your model is the number of elements through the thickness of the wall. Please show a close-up image of the mesh that shows how many elements are across the thickness.
September 23, 2021 at 3:39 amSeptember 23, 2021 at 12:12 pmpeteroznewman
SubscriberTo accurately simulate plasticity, you want at least 4 elements (and preferably more) through the thickness. This mesh has 1 element through the thickness.
Using tet elements will create a very large model because you will have an element size of t/4 to get four elements through the thickness.
Take some time to slice the geometry up into sweepable solids so that you can use a Mesh Method of Sweep that allows you to specify 4 elements in the sweep direction while using a larger element size in the other directions.
September 23, 2021 at 5:50 pmSeptember 23, 2021 at 5:53 pmISSAMAZERTY
SubscriberI have used 0 for the Tangent Modulus.
September 23, 2021 at 7:51 pmpeteroznewman
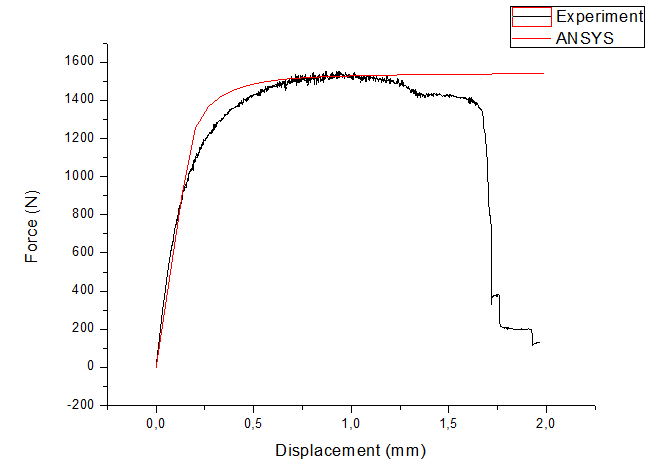
SubscriberPlease overlay the experimental force displacement curve with the simulation force displacement curve.
September 23, 2021 at 10:01 pmSeptember 24, 2021 at 12:10 ampeteroznewman
SubscriberThe simulation model is too stiff initially. You can either make the geometry slightly thinner, or reduce the Young's modulus. I would do the second.
Divide the initial slope of the experimental Force Displacement by the initial slope of the simulation Force Displacement curve to get a reduction factor. Multiply that factor by the Young's modulus to get a new Young's Modulus to rerun the simulation.
September 24, 2021 at 3:23 amSeptember 24, 2021 at 4:00 amSeptember 24, 2021 at 2:31 pmISSAMAZERTY
SubscriberCan I reduce Young's modulus?
Isn't that a change in the material with which I'm doing the experiment?
September 25, 2021 at 12:19 ampeteroznewman
SubscriberI expect your structure is 3D printed. Where did the Young's modulus value come from?
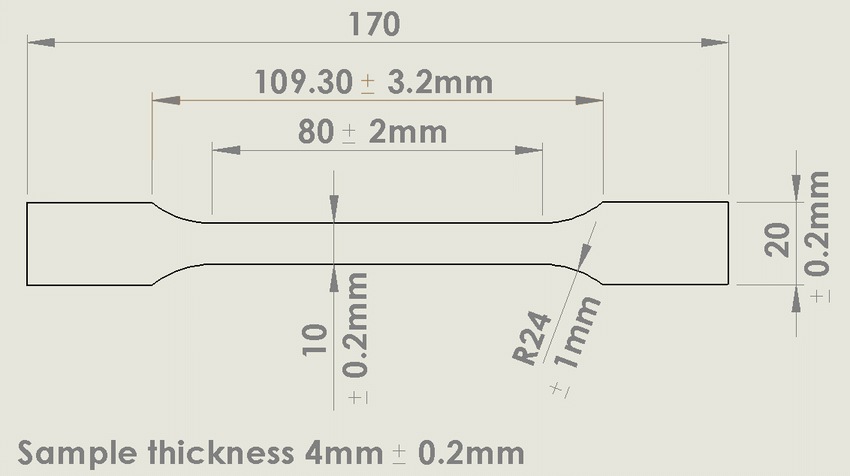
Print solid tensile test coupons in different directions to obtain force-displacement data from multiple samples, and convert them into Stress-Strain data. You need to use an Instron type tensile testing machine with a proper extensometer to measure displacement in a 40 mm gauge length at the center. Show the data, labeled by print direction. You have to print with these coupons flat on the bed, with a 4 mm build height as well as vertical with a 170 mm build height and some off at other angles.
 September 25, 2021 at 9:39 pmSeptember 25, 2021 at 9:41 pm
ISSAMAZERTY
SubscriberDo you have any idea how to solve this problem, or a way to find out the complete displacement of the structure?
Thanks
September 25, 2021 at 9:46 pmISSAMAZERTY
SubscriberI hope I explained the problem well, sir.
September 25, 2021 at 9:50 pmpeteroznewman
SubscriberAre you saying that solid, flat, tensile test coupons were printed and tested in the same machine that is pulling the complex 3D shape with curves and holes?
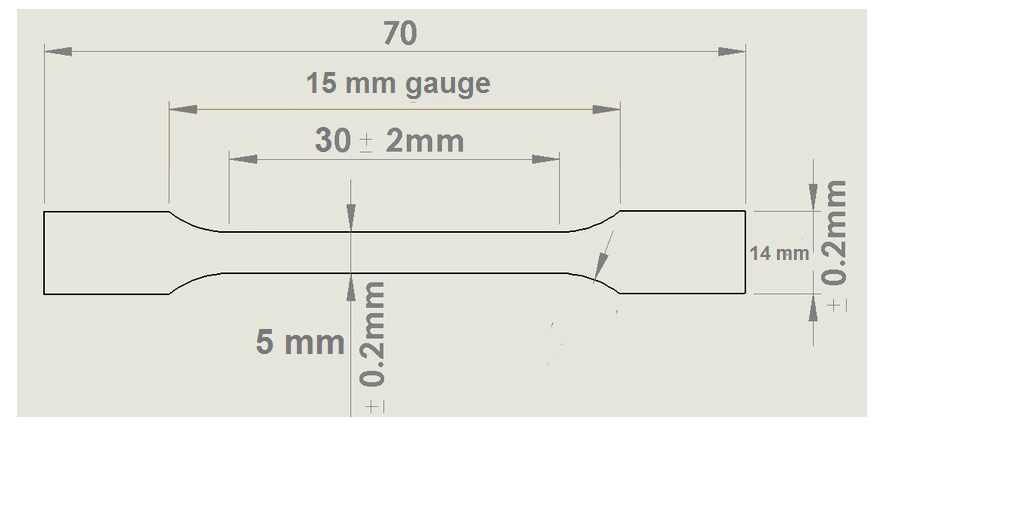
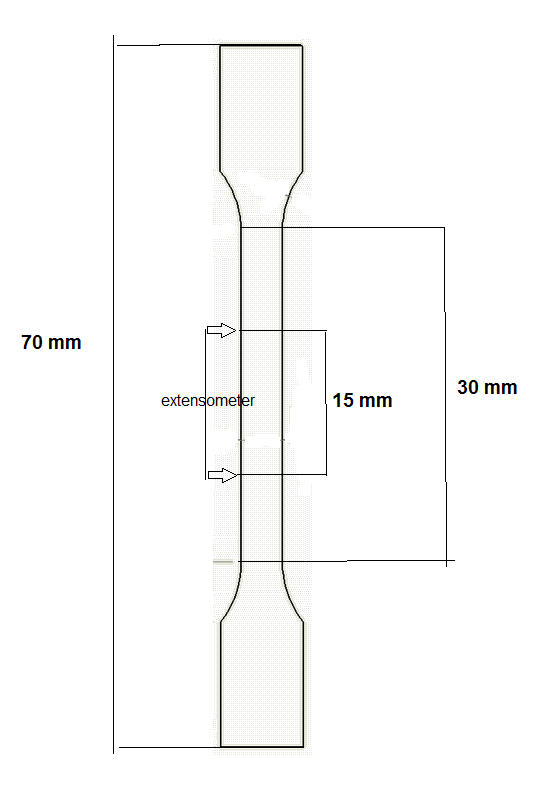
What do you mean you only have the stroke value of the gauge? Is that for the tensile test coupon? Was an extensometer used to measure the gauge length elongation? What was the gauge length that the extensometer was place along?
Please reply with a full description. Add some images or figures to make it clear what was measured.
September 25, 2021 at 10:20 pmSeptember 25, 2021 at 10:22 pmISSAMAZERTY
SubscriberThe extensometer is placed to select 15 mm in the middle.
Thanks.
September 25, 2021 at 11:59 pmISSAMAZERTY
SubscriberSorry, the stroke value is only set in 15mm (in place of the extensometer)
September 26, 2021 at 2:25 ampeteroznewman
SubscriberSo a tensile coupon was printed on the same 3D printer that printed the 3D structure. Good. Was it printed in at least two build directions? Flat on the platen with a build thickness of 4 mm and built vertically with a build thickness of 70 mm. The properties of the material may change with build direction.
If you have the force and extension values on the 15 mm gauge length, you can convert that to stress and strain values. If you want to attach an Excel spreadsheet, you have to put it in a zip archive first. I use the 7z format.
September 26, 2021 at 2:33 amSeptember 26, 2021 at 10:10 ampeteroznewman
SubscriberCreate a Multilinear Plasticity material model.
September 26, 2021 at 7:04 pmISSAMAZERTY
SubscriberHello Mr. Peter.
I used the method you mentioned, but I'm still facing the same problem.
(I used the material's stress-strain curve).
Thanks.
September 26, 2021 at 10:10 pmpeteroznewman
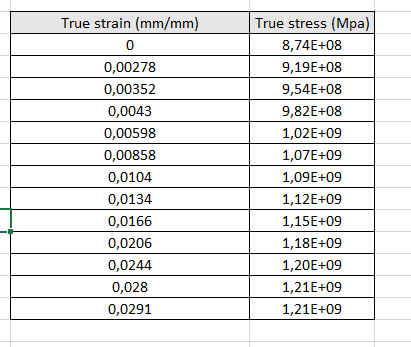
SubscriberDid you implement the conversion from Engineering Stress and Strain to True Stress and Strain correctly? You can attach the spreadsheet by putting it in a 7zip archive.
Conversion of Engineering Stress and Strain to True Stress and Strain can only be done up to the point when necking begins. You can't use the experimental data from the tensile test after necking begins because the equations used in the conversion have an assumption that the plasticity is uniform over the entire gauge length, width and thickness (constant volume assumption). That is violated as soon as necking begins. So mark in the spreadsheet the rows where the necking was present in the data.
The simulation is not going to exactly match the experimental data. How close are the curves with the latest revision to the model with the new material model?
September 26, 2021 at 10:49 pmISSAMAZERTY
SubscriberI did not understand what is required is the excel file for the material or for the experiment.
I'm importing the material's curve stress-strain file into ANSYS (the material's values are trues).
I need more clarification.
Thanks.
September 27, 2021 at 10:45 ampeteroznewman
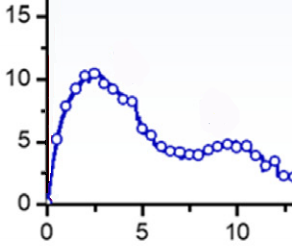
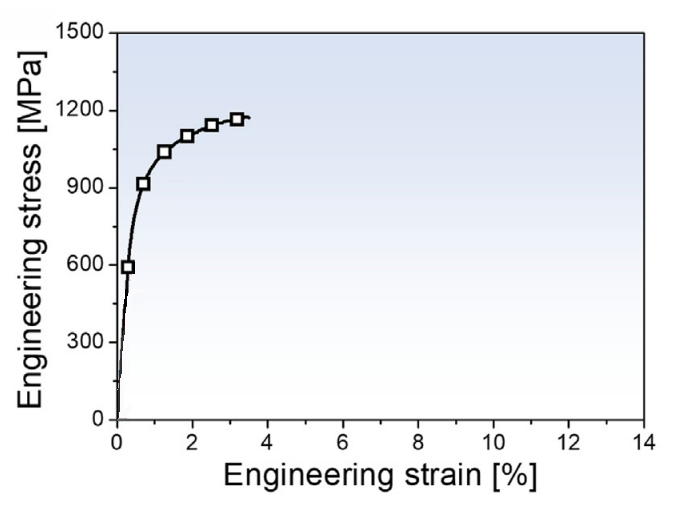
SubscriberIn one of your posts, you inserted this image. Is this material data from a flat tensile test coupon or from the 3D structure?
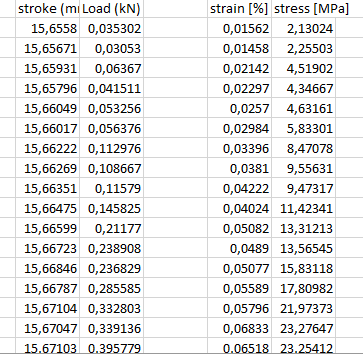 You use the stress-strain data from the material test of the flat tensile test coupon. Data from that test is in terms of Engineering Stress and Engineering Strain. It must be converted into True Stress and True Strain to use in a Multilinear Kinematic Hardening Plasticity material model. I want to see a plot of the Engineering Stress and Engineering Strain.
September 27, 2021 at 4:58 pmSeptember 27, 2021 at 9:08 pmpeteroznewman
SubscriberYou should convert the data in the material spreadsheet to True Stress True Strain, then create a Multilinear Kinematic Hardening plasticity material model.
September 27, 2021 at 9:22 pmSeptember 27, 2021 at 9:28 pmpeteroznewman
SubscriberYou have good agreement between the experimental force-displacement and the simulation force-displacement.
Conversion to Stress is problematic with a complex 3D structure full of holes. What area do you use?
Let's stick to force-displacement.
September 27, 2021 at 10:05 pmSeptember 27, 2021 at 11:11 pmNovember 3, 2021 at 5:53 pmJaniraBei
SubscriberGood evening,
I readanswer about Tension Force and since I'm facing the same problem with a lattice structure I'd like to know how I can request the Tension Force to the solver.
Thanks for helping!
November 3, 2021 at 9:13 pmpeteroznewman
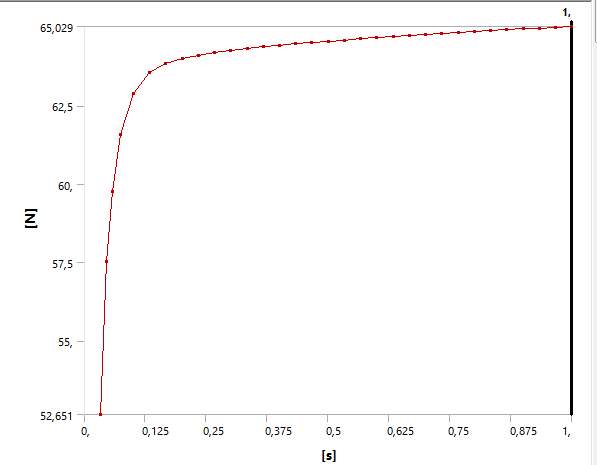
SubscriberInsert into the Solution branch in Workbench a Probe of the Reaction Force of the Displacement that is causing the sample to be compressed or stretched.
November 4, 2021 at 10:41 amJaniraBei
SubscriberThank you so much!
Viewing 57 reply threads- The topic ‘Why does the structure not affect the results in a tensile test?’ is closed to new replies.
Innovation SpaceTrending discussionsTop Contributors-
4673
-
1565
-
1386
-
1231
-
1021
Top Rated Tags© 2025 Copyright ANSYS, Inc. All rights reserved.
Ansys does not support the usage of unauthorized Ansys software. Please visit www.ansys.com to obtain an official distribution.
-


Ansys Assistant

Welcome to Ansys Assistant!
An AI-based virtual assistant for active Ansys Academic Customers. Please login using your university issued email address.
Hey there, you are quite inquisitive! You have hit your hourly question limit. Please retry after '10' minutes. For questions, please reach out to ansyslearn@ansys.com.
RETRY
