
-
-
June 10, 2021 at 11:28 am
MickMack
SubscriberHi,
I want to create a chart in excel (i assume this is the best program) comparing the directional velocity of two nodes from two separate models.
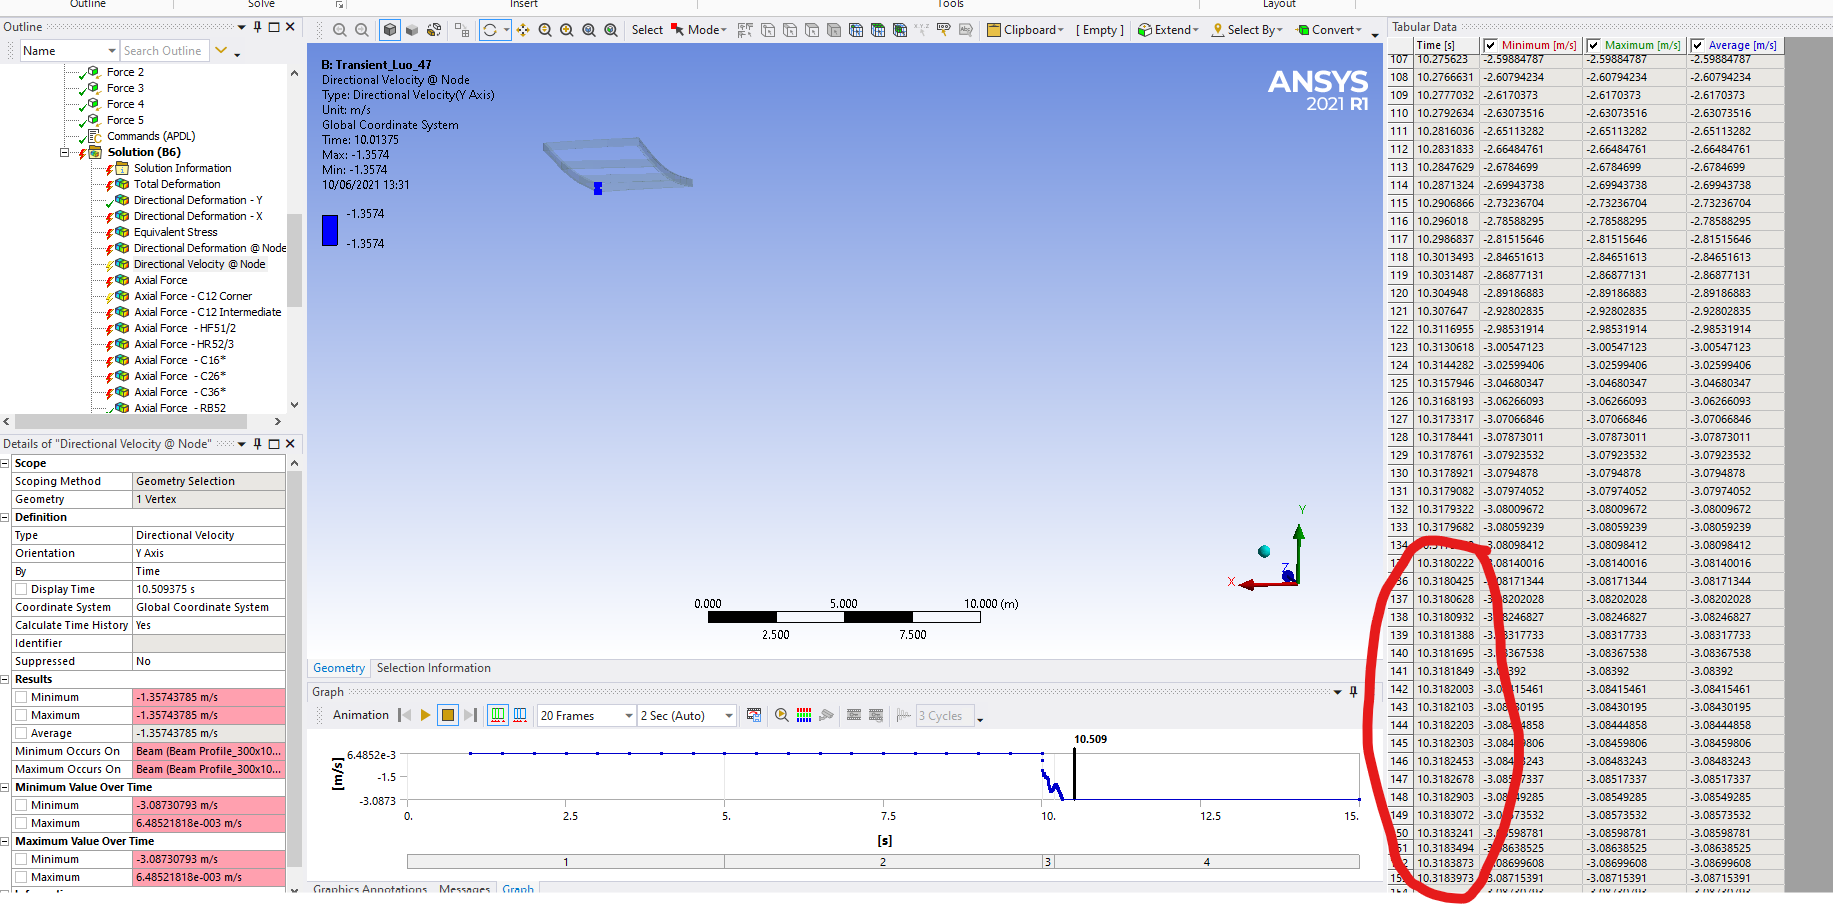
I have simply copied the tabular data from Mechanical and pasted it into excel to create my chart. As the minimum time step is 0.00001, the time is in increments beyond 3 decimal places.
However as highlighted in the snippet below, the time displayed is to 3 decimal places, therefore the values when imported into excel display the same time 10.318, which is inaccurate.
How do i increase the time precision to 5 decimal places?
Any other advice on effeecient and effective ways to generate charts would be greatly appreciated.
Regards,
Michael
June 10, 2021 at 12:00 pmErKo
Ansys EmployeeHi
Try to go to Workbench and main menu -> Tools -> Appearance and significant digits (as shown below) and change that to 9 say and press OK.
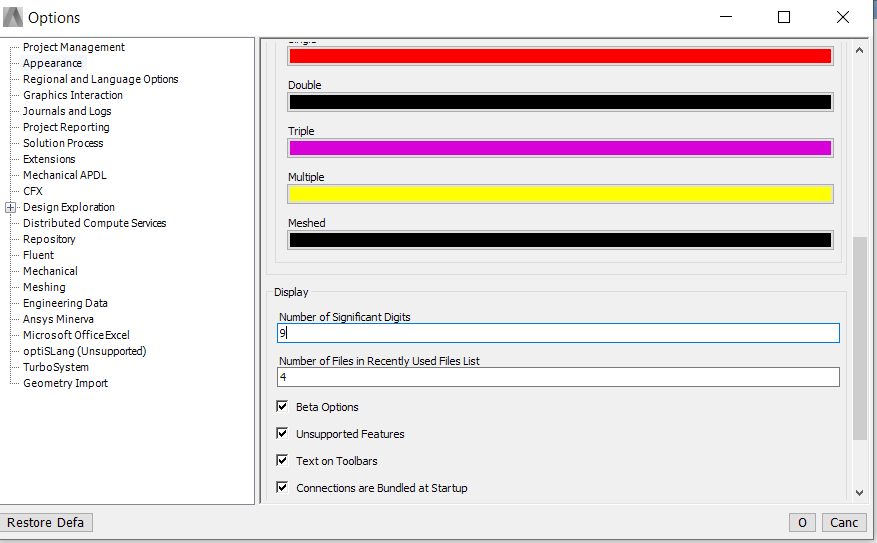
All the best
Erik
June 10, 2021 at 12:38 pmSubscriber
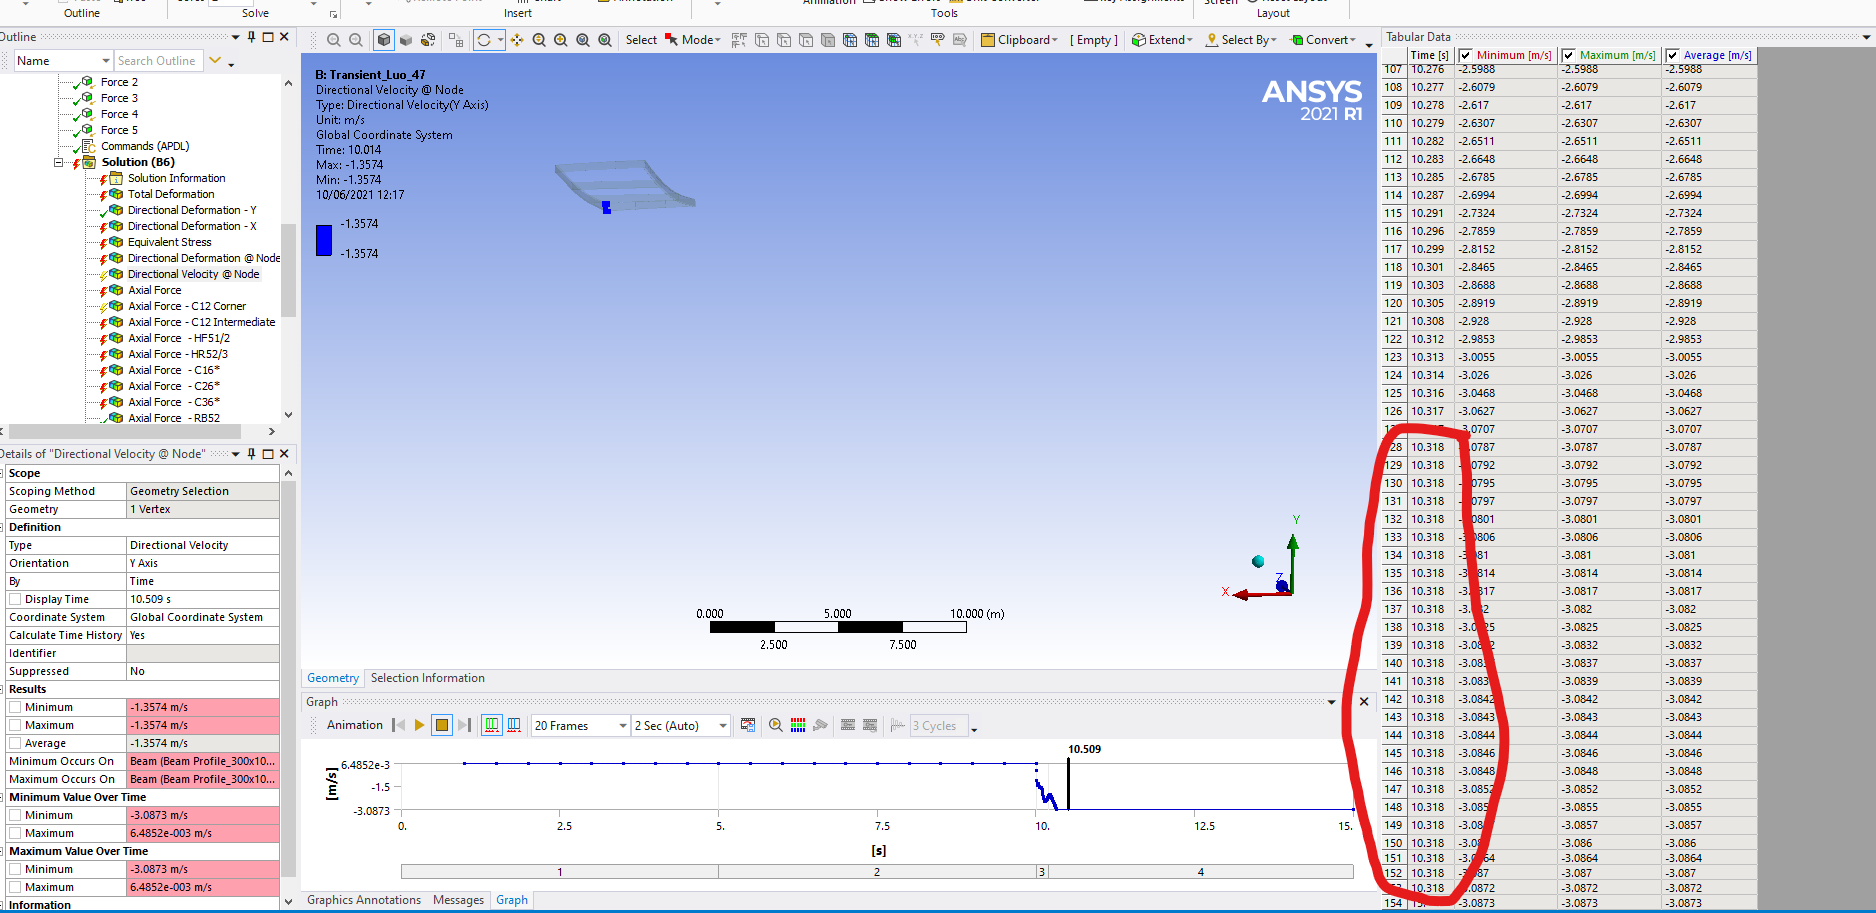
That worked perfectly thank you very much, i include a snippet below with the same times highlighted.
Can i also ask is this the most efficient way for generating graphs in excel?
Regards Michael
June 10, 2021 at 1:56 pmAnsys EmployeeHi
I would say copy the table and paste into excel .
One can also right mouse button click on results objects (say Stress, Total Deformation,...) -> export a txt/csv file.
All the best
Erik
June 10, 2021 at 2:04 pmSubscriberMany Thanks
Viewing 4 reply threads- The topic ‘How to adjust time displayed for creating a graph in excel?’ is closed to new replies.
Innovation Space Trending discussions
 Top Contributors
-
peteroznewman
 6660
6660 -
scabo
 1906
1906 -
Dennis Chen
 1469
1469 -
javat33489
 1313
1313 -
Shyam Prasad V Atri
1022
Top Rated Tags
© 2026 Copyright ANSYS, Inc. All rights reserved.
Ansys does not support the usage of unauthorized Ansys software. Please visit www.ansys.com to obtain an official distribution.
-


The Ansys Learning Forum is a public forum. You are prohibited from providing (i) information that is confidential to You, your employer, or any third party, (ii) Personal Data or individually identifiable health information, (iii) any information that is U.S. Government Classified, Controlled Unclassified Information, International Traffic in Arms Regulators (ITAR) or Export Administration Regulators (EAR) controlled or otherwise have been determined by the United States Government or by a foreign government to require protection against unauthorized disclosure for reasons of national security, or (iv) topics or information restricted by the People's Republic of China data protection and privacy laws.
