TAGGED: ansys-fluent, cfd, fluids, ls-dyna
-
-
May 7, 2021 at 7:52 am
LCP
SubscriberHi everyone,
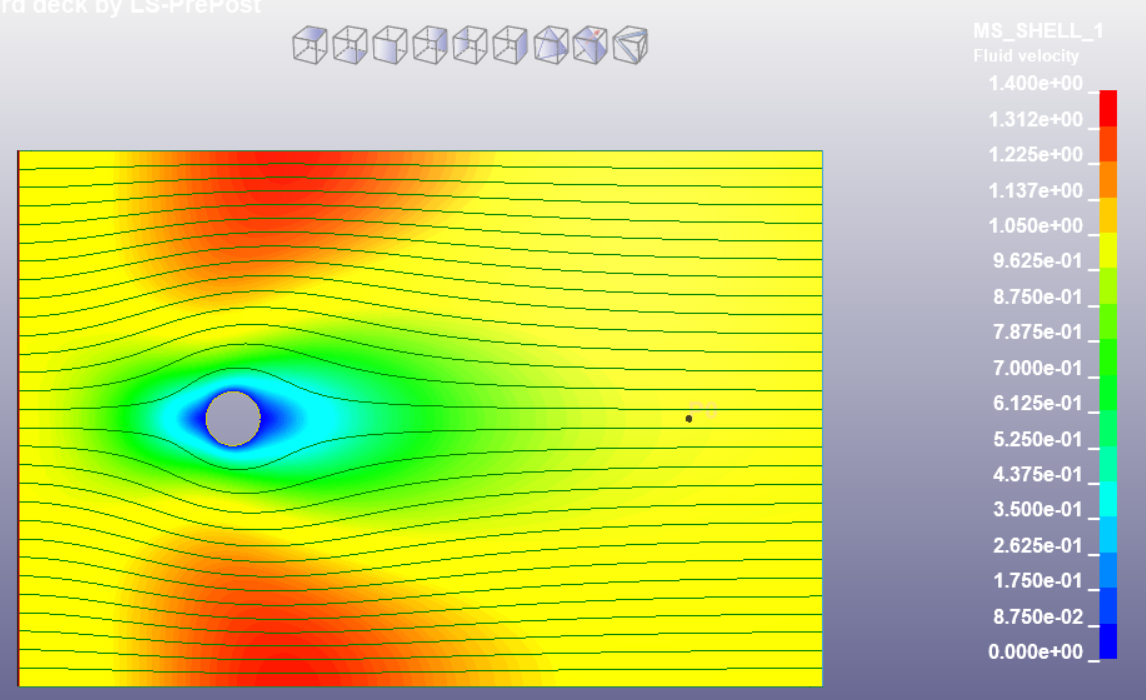
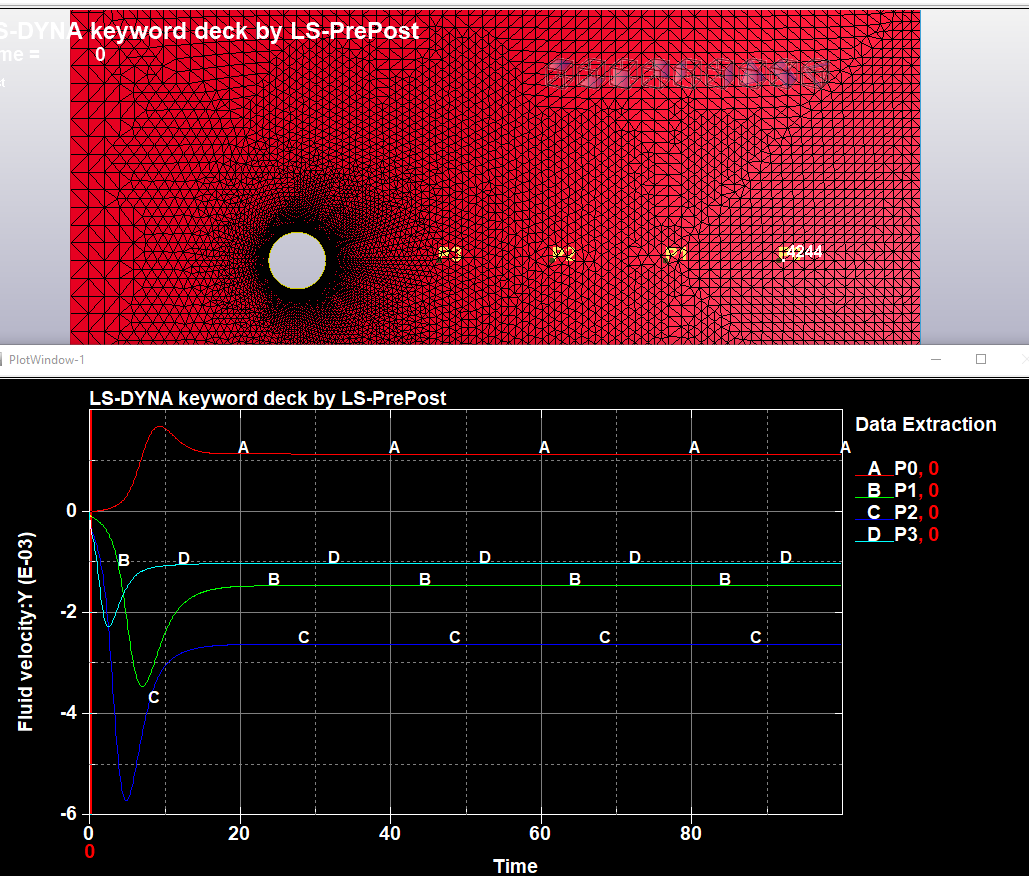
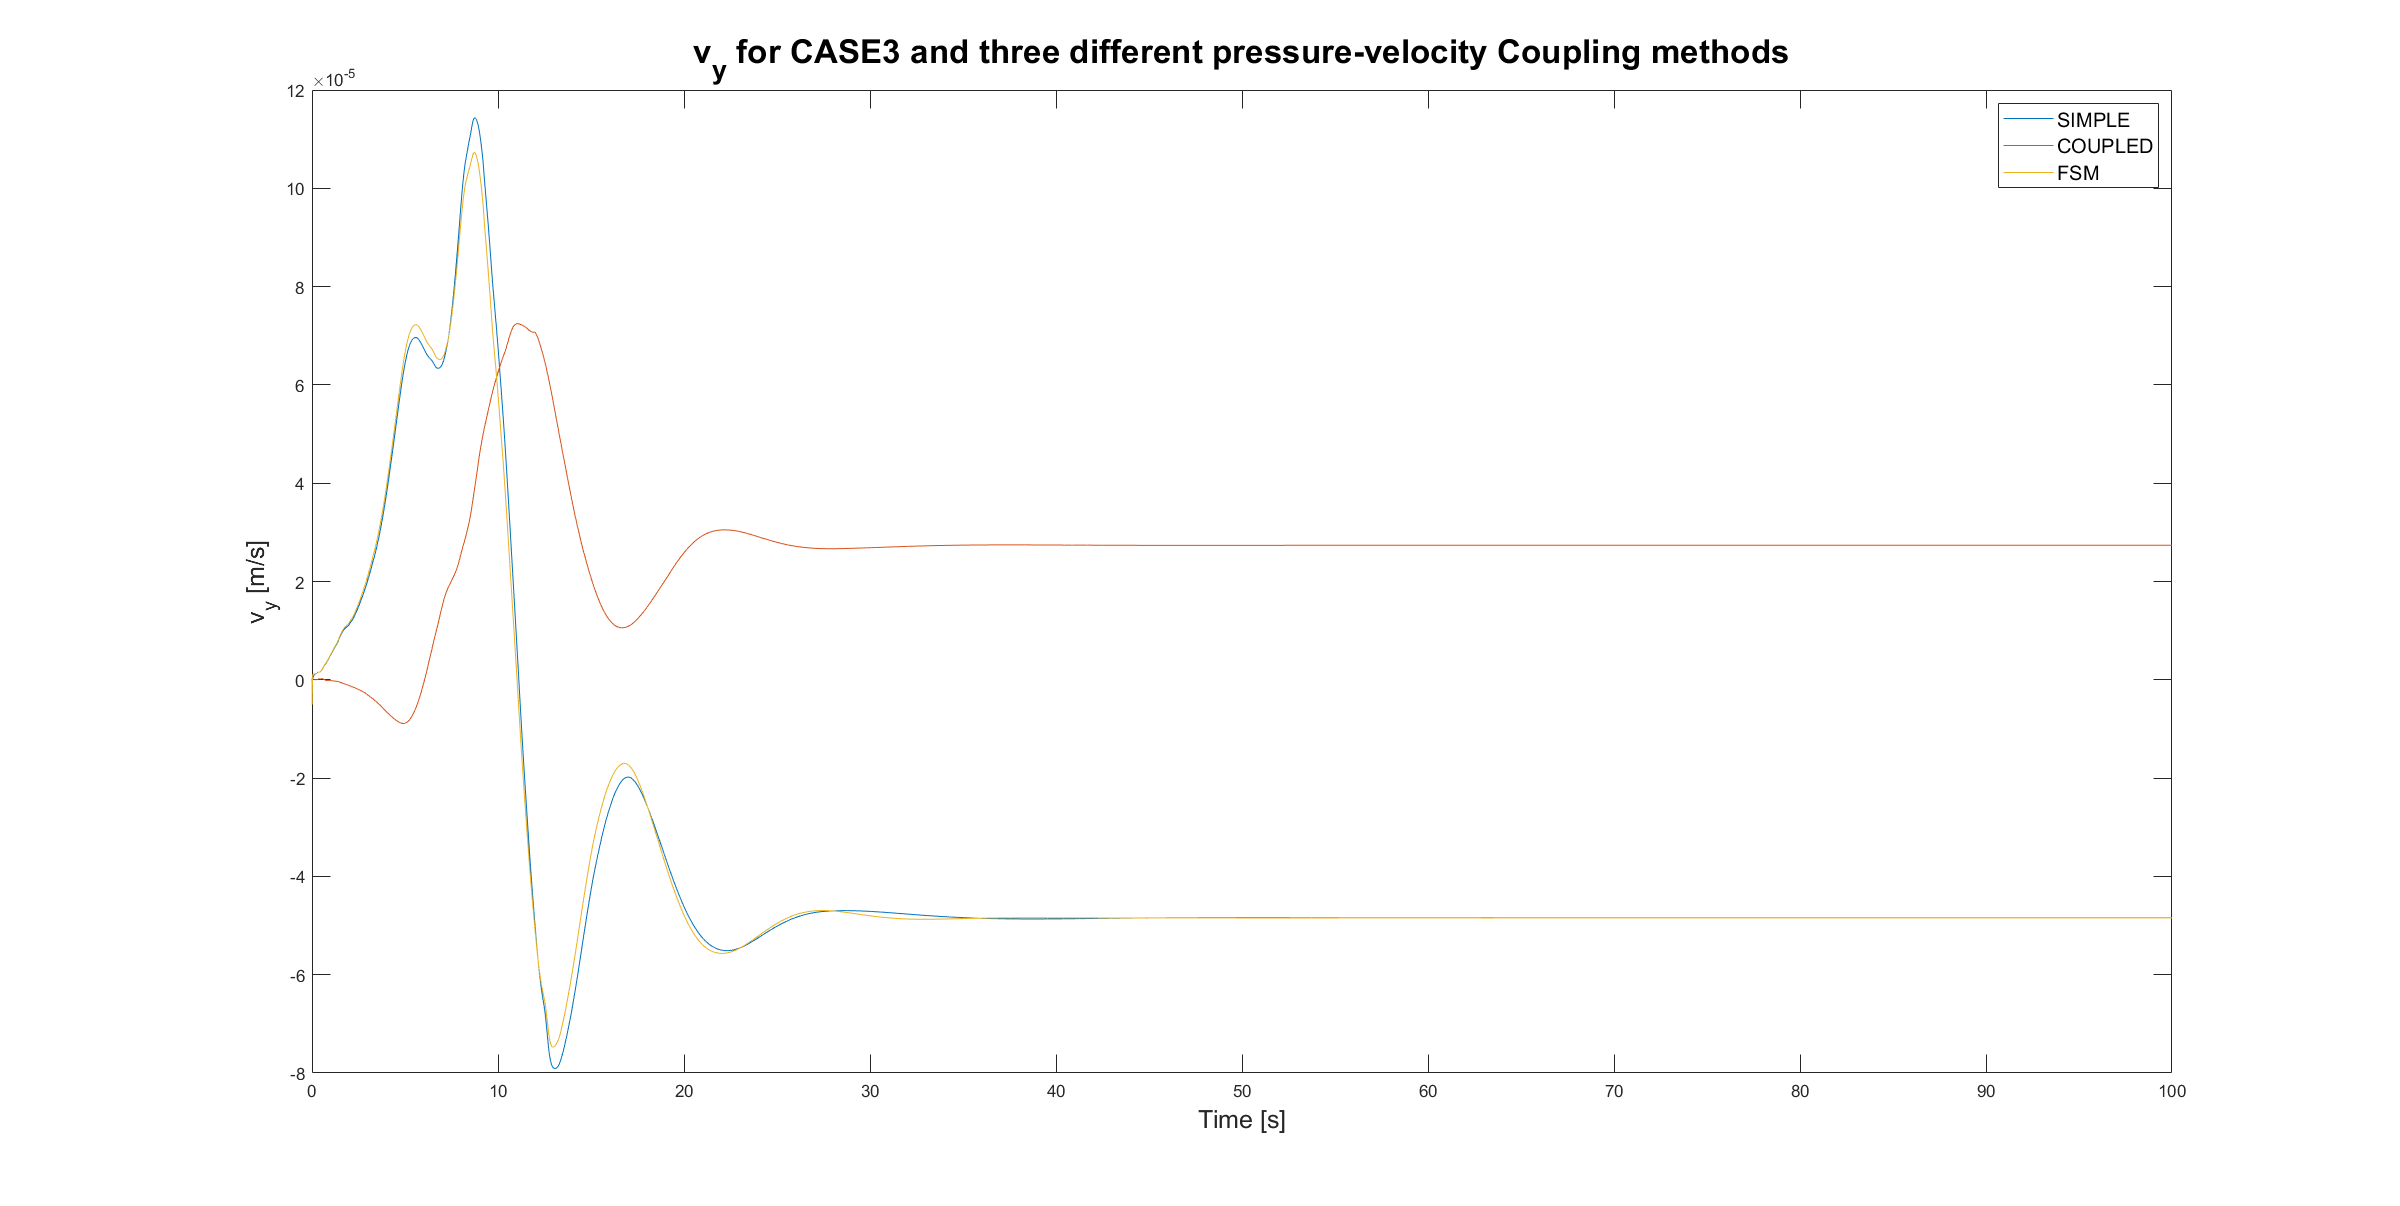
(Picture 1: velocity magnitude contour plot, with streamlines and point of interest. Picture 2: y-velocity data plot in point of interest. Picture 3: comparison of y-velocity from ANSYS FLUENT and LS-DYNA ICFD solver. Picture 4: y-velocity contour plot, comparison between colour in plot on point of interest and legend).
I am currently running a "benchmark" iCFD problem (flow around a cylinder) using LS-DYNA, for Re = 0.5. I am interested in the y-velocity at a point 8 diameters from the cylinder (see pictures below).
When I extract the dataplot from this point, you can see that the velocity is 6e-4 m/s. When I compare this result to the contourplot, however, you can see that the color where the point is situated belongs more to the 2.5e-4 m/s y-velocity.
When comparing the LS-DYNA answer to the FLUENT answer, it is clear that indeed the y-velocity should be much lower than 6e-4 m/s. So why does the dataplot give me a different result, and how can I get the right result?
Kind regards,
May 13, 2021 at 6:18 pmtslavik
Ansys EmployeeThis looks indeed like a strange issue. Which version of LSPP has been used for this ? Perhaps try the newest version V4.8 or V4.9 (Dev). If a DataPoint/Nodout object is created and used on the neighboring nodes instead of a Pointout, what happens ?
One thing to keep in mind is that Re=0.5 is pretty low so the fractional step hypothesis starts to break down and some error is expected when compared to the empirical equation.
For low Reynolds a monolithic approach may be more accurate than the fractional step (see *ICFD_CONTROL_MONOLITHIC).
May 17, 2021 at 7:33 amSubscriber
Thank you for your response. I am using the student version of LS-DYNA, so this is ANSYS 2020R2 LS-DYNA Student 12.0.0.
I am honestly not entirely sure what the difference is between Nodout and Pointout, but the way I defined the point in the DataPlot is seen in the picture I added below. I chose the coordinates of a point. As you can see, this point is not situated on a node (so maybe something goes wrong during interpolation of course, and that would be the only issue. But I would have to check if this discrepancy is also happening for e.g. Re=1000.). Then I identified the node nearest to this point. This is node 4244. But when I look into my mesh file, this node does not exist. Somewhere along the path of going from an ordinary mesh to a multisolver mesh, I loose all information about my mesh. You can also see that I am not "allowed" to choose a node in the DataPlot object properties menu.
Also below I have added a picture of the y-velocities at four different points behind the cylinder. Is this what you meant with "If a DataPoint/Nodout object is created and used on the neighboring nodes instead of a Pointout, what happens?" ?
And thank you for the tip about the fractional step solver inaccuracy! I will also run it in a monolithic manner. But at around what Reynolds number should I not use monolithic anymore? And If I want to compare the LS-DYNA results to the ANSYS FLUENT results, should I then use the simple, coupled, or FSM method for the pressure-velocity coupling method in FLUENT? (see last picture for the comparison).
Kind regards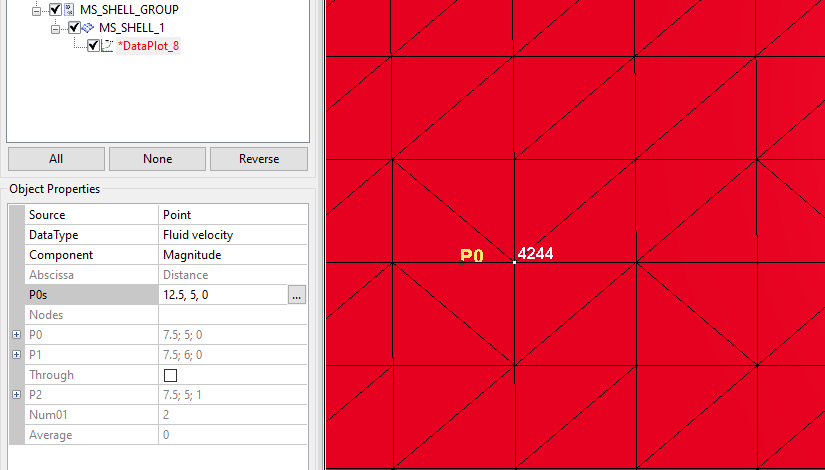
Viewing 2 reply threads- The topic ‘Discrepancy between DataPlot and Contour Plot’ is closed to new replies.
Innovation Space Trending discussions
 Top Contributors
-
peteroznewman
 6450
6450 -
scabo
 1906
1906 -
Dennis Chen
 1457
1457 -
javat33489
 1308
1308 -
Shyam Prasad V Atri
1022
Top Rated Tags
© 2026 Copyright ANSYS, Inc. All rights reserved.
Ansys does not support the usage of unauthorized Ansys software. Please visit www.ansys.com to obtain an official distribution.
-