Transient Multiphase Simulation and Post-Processing: Visualization
Goal: To visualize simulated results during the post-processing stage
Non-Newtonian Fluid:Cemented Backfill paste
I am conducting a multiphase transient simulation in which slurry (comprising water, cement, and tailings) is discharged into a tunnel through an eight-inch-diameter pipe (see Figure 1).
The tunnel is roughly 60 feet (18.3 m) long, 7.5 feet (2.3 m) wide, and 15 feet (4.6 m) high. The pipeline is mounted along the ceiling, with the discharge point located 20 feet from the tunnel's end. A 4-inch-diameter breather pipe, also along the ceiling, allows air to escape as the tunnel fills with slurry. (Figure 4 shows material and boundary conditions set during simulation)
The simulation is now complete, and I am in the post-processing phase, aiming to visualize the fill profile. I created a volume and a corresponding legend for the isovolume: red shows filled cells (100- 10.1), yellow indicates intermediate levels (10- 0.1), and blue (0.1- 0.0) represents unfilled cells (air presence), as shown in Figure 1.
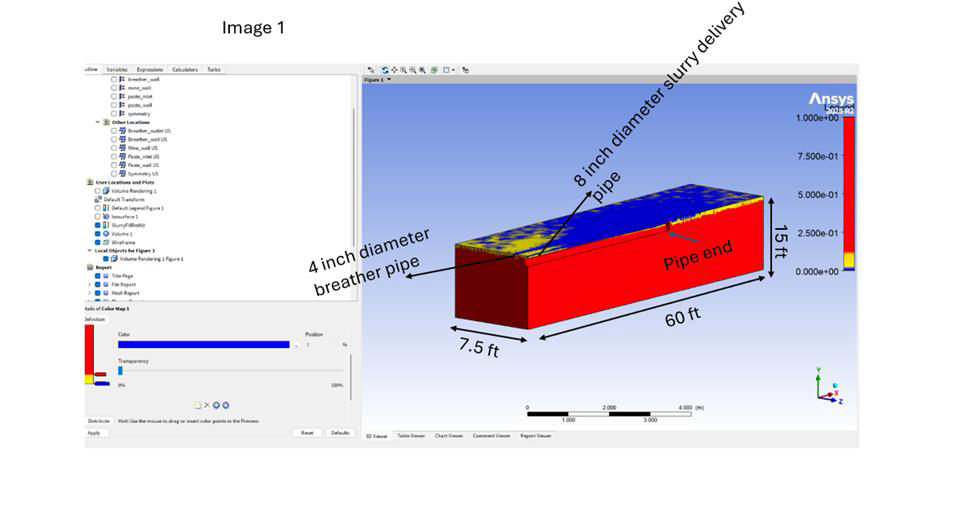
Figure 1: Red >100–10.1, yellow >10–0.1, blue > 0.1–0.0. The picture looks closer to what I want (filled at the bottom, air at the top).
Summary in post-processing
➢Created an Isovolume (Insert → Location → Volume → Method = Isovolume).
➢Colored the volume and edited the legend/colormap to match the description above.
I then created a second legend for the same purpose, but this time I assigned red a value between 100 and 50, yellow an intermediate range of 49.9 to 10.1, and blue from 10 down to
0.0. However, I can't see the actual filled cells I expected. The bottom section is entirely yellow (see Figure 2). I expected red at the bottom to indicate filled cells, followed by yellow as an
intermediary, and blue at the top. Please help me understand how to properly set up the legend and color coding so I can achieve the desired view.
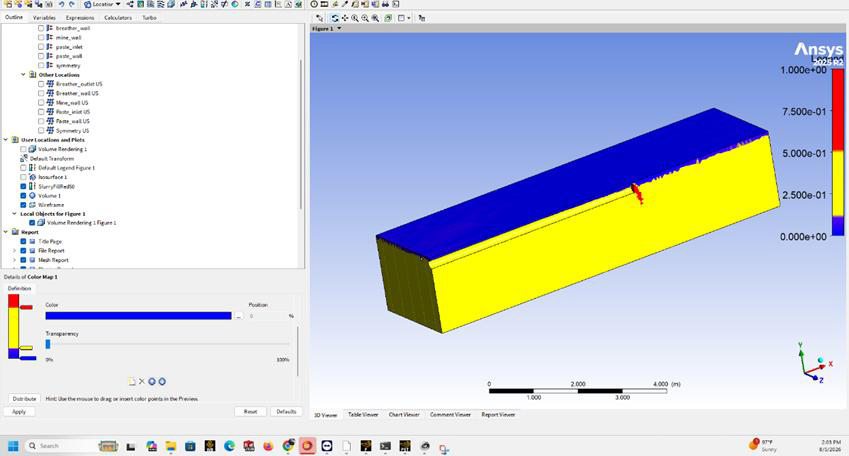
Figure 2: Red = 100–50, yellow = 49.9–10.1, blue = 10–0.0. The bottom is entirely yellow. I do not see a red-filled zone except at paste_inlet.
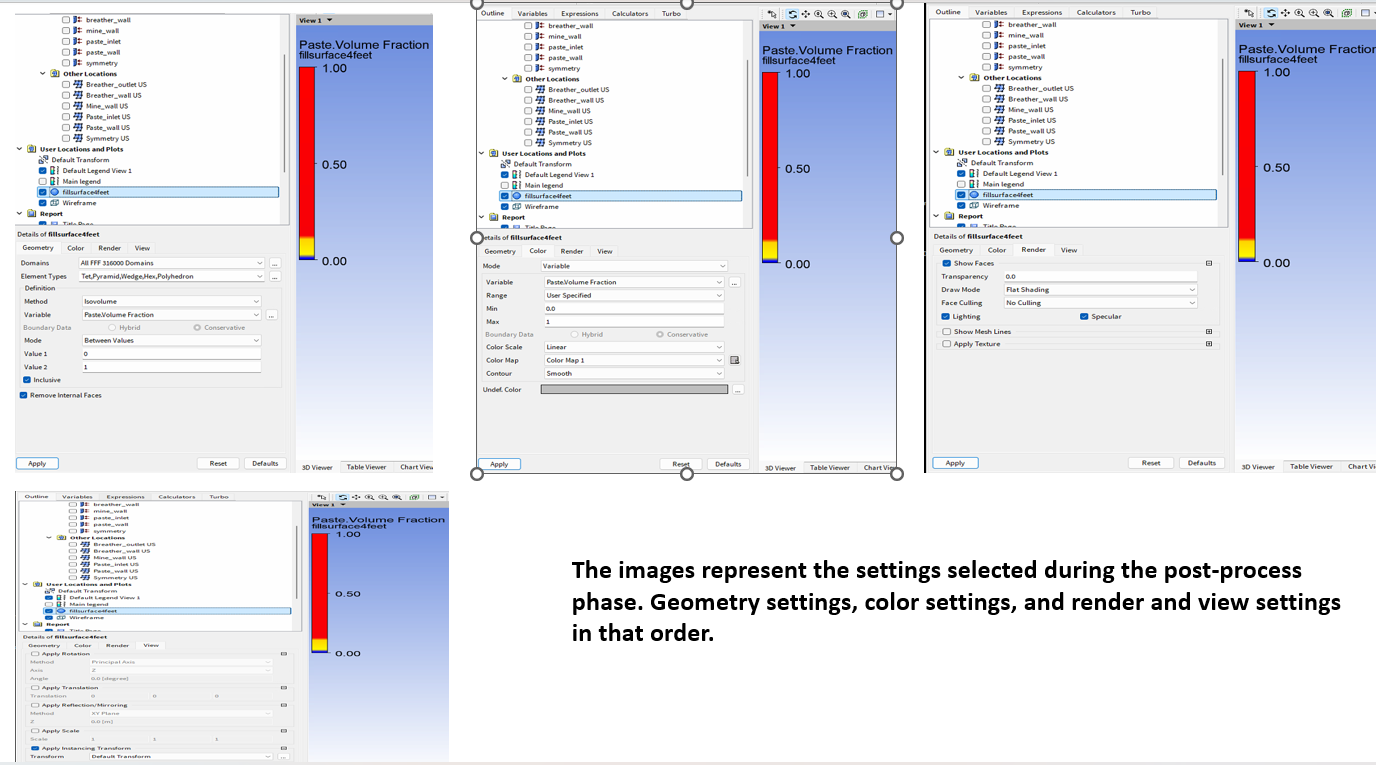
Figure 3: Geometry settings selected
To help me get this visualization right,
➢What is the correct way to set a 3-color user map for this fill profile?
➢For VOF, should the color map use a 0–1 scale instead?
Materials and boundary conditions
The Herschel-Bulkley parameters used in the baseline CPB simulations were theoretical values selected from the literature reviewed for this study. The final Fluent implementation used a yield stress τy = 75 Pa, consistency index K = 8 Pa·sⁿ, flow index n = 0.5, and a critical shear rate of 0.001 s⁻¹. Because the Herschel-Bulkley formulation was regularized with the critical shear rate, separate minimum and maximum viscosity limits were not independently prescribed.
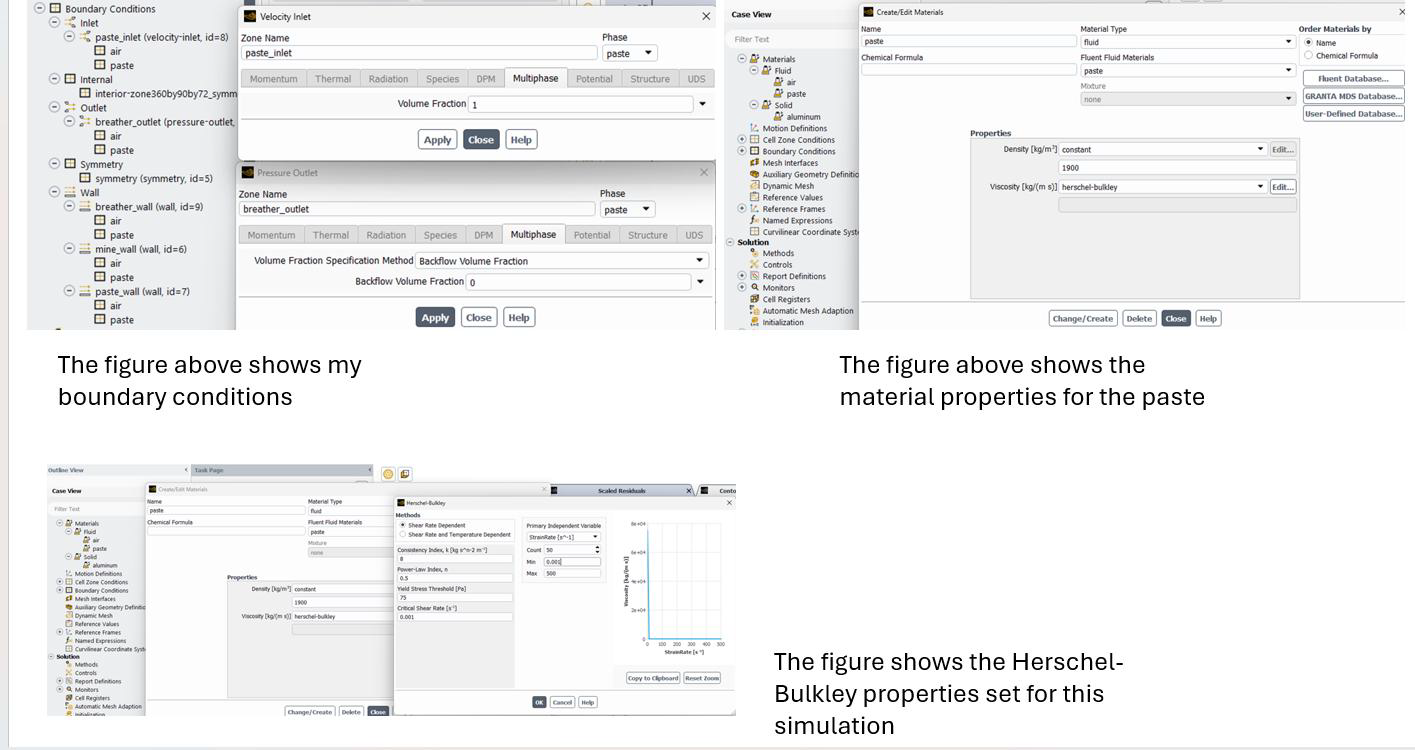
Figure 4: Materials and boundary conditions for the simulation






















 You are navigating away from the AIS Discovery experience