Hello everyone,
This is the first time I am posting something, so let me know if there are different guidelines.
I am currently working on designing a 50 Ohm microstrip line and obtaining the required width for a certain trace thickness and dielectric height. With these dimensions I then want to characterize the line in terms of S-parameters and other things.
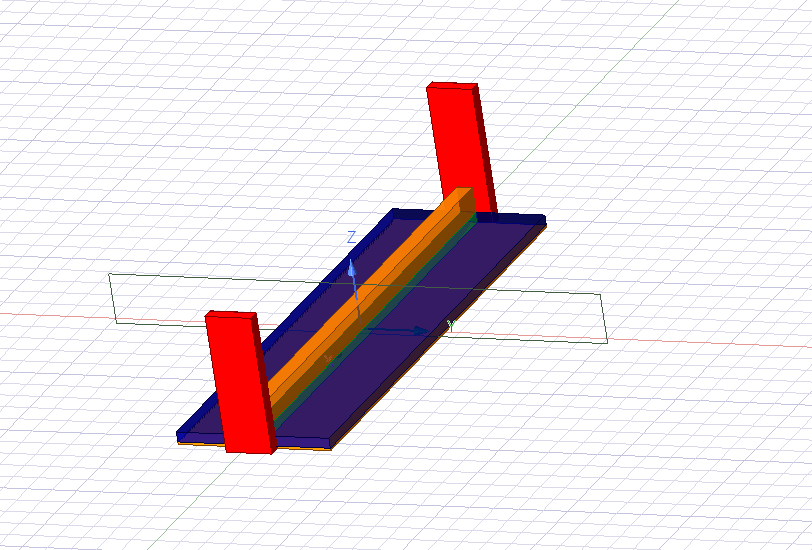
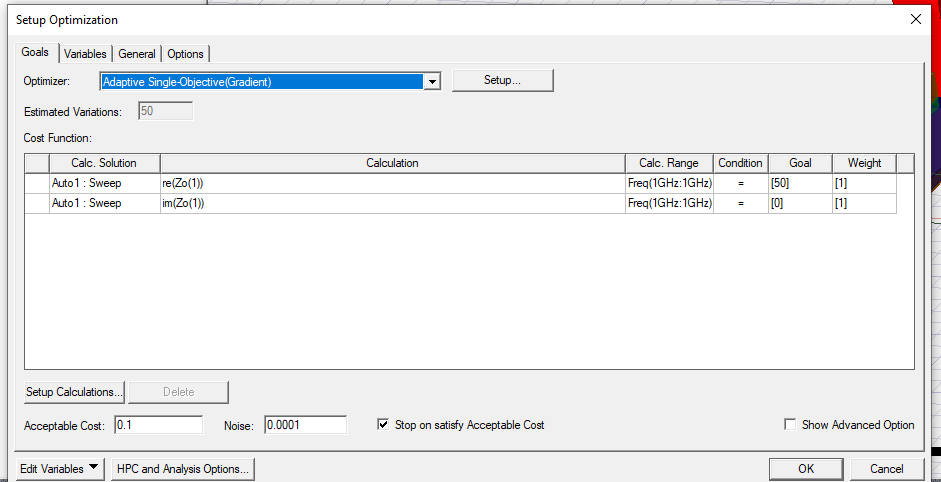
My current working procedure is as follows in HFSS 3D, where I added screenshots below this post of my design view and optimizer.
The setup is based on this video:
- created a modal driven problem type with an auto-open region, which in my understanding makes it automatically "air" outside of the model?
- I have created a 1um GND plane of 1 mm length and 100 um width, with the "copper" material. It is set to "finite conductivity".
- On top of that is a dielectric, I use polyimide, with height H, which is around 10 um.
- On op of that is a copper trace of thickness T, around 5 um and a certain width W.
- I put two PEC plates against the ends, that cover the signal trace completely and GND plane partly (as I do not extend the PEC plates fully to the side)
- These two plates are my ports, and I define their faces as Wave ports.
- The sweep is set to 1.0 GHz initially and is a model driven solution, as my ports are waveports.
- I run an optimizer that tries to obtain re(Z0(1)) = 50, so a 50 Ohm characteristic impedance of the first port. I could also do re(Z0(2)) but they give the same result as it is symmetrical. I have tried setting im(Z0(1)) to 0 but it does not seem to do much.
- I have automated this with PyAEDT and thus have a huge csv file for 4 frequencies: 1 MHz, 0.5 GHz, 1.0 GHz and 5.0 GHz. In between these frequencies I can then interpolate.
My question now is how to know whether this is correct. I have done the following:
- Written a python code that solves the required W for a Z0 of 50 Ohm for the T and H that I give, based on: https://qucs.sourceforge.net/tech/node75.html
- Put all combinations manually into the LineCalc solver of ADS Keysight.
- Created a Q2D model that uses my dimensions.
For the python code and Linecalc, the results diverge completely. The Q2D model agrees with the HFSS 3D however it gives me around 10% different W, for a given freq, H and T.
How should I proceed to verify my solution Any direction, thoughts or help would be much appreciated!
Cheers,
Paul