Numerical Results – Lesson 7
Particle/Vortex Plot
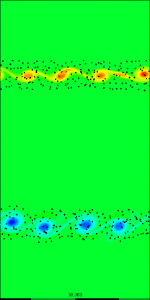
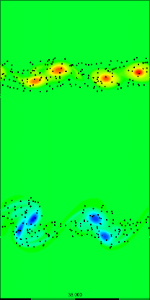
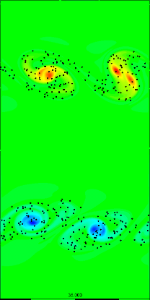
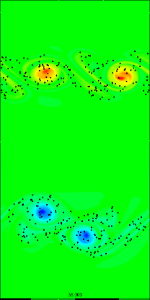
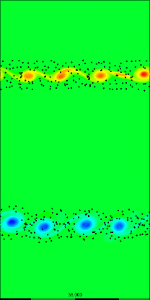
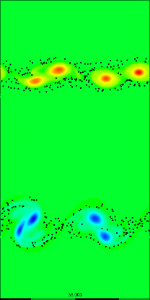
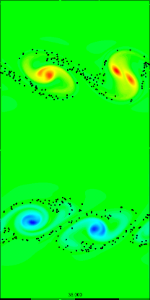
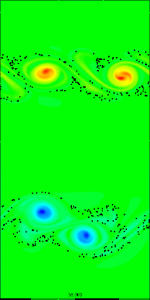
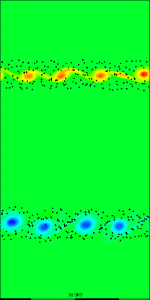
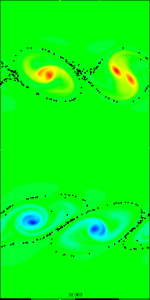
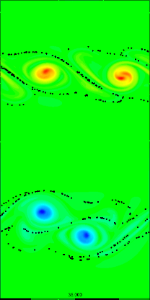
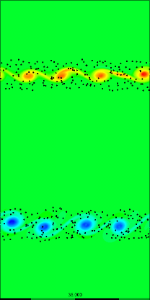
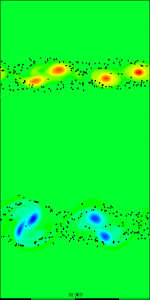
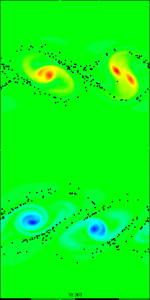
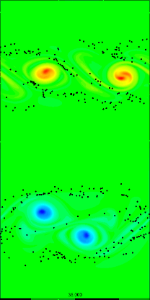
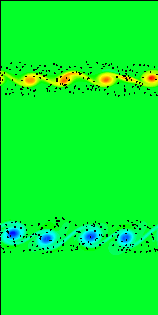
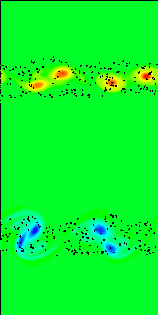
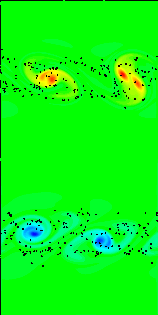
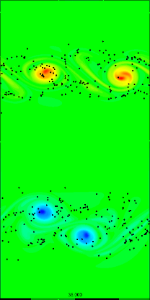
The background is a plot of the vorticity: the Z component of the curl of the velocity field. Red stands for positive value (counterclockwise rotation) and blue stands for a negative value (clockwise rotation). The particles are not plotted in accordance with their actual diameter, but rather a constant of 0.3 for better visual purposes.
From the results below, we can observe maximum coupling between the particles and the vortices at Stokes number = 1. We can observe particles being trapped in the vortices at Stokes number = 0 condition and ballistic motion of particles at Stokes number = 100. The results for Stokes number = 0.2 and Stokes Number = 5 tend to be more intermediate and less apparent.
| Stokes/Time | t = 0.5 (s) | t = 20 (s) | t = 40 (s) | t = 60 (s) | t = 80 (s) |
|---|---|---|---|---|---|
| Stk = 0 | 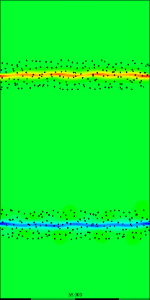 |
 |
 |
 |
 |
| Stk = 0.2 | 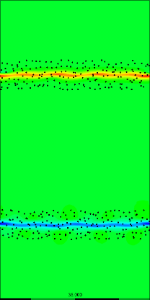 |
 |
 |
 |
 |
| Stk = 1 | 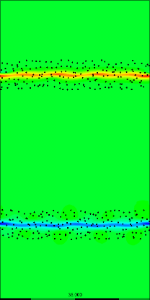 |
 |
 |
 |
 |
| Stk = 5 | 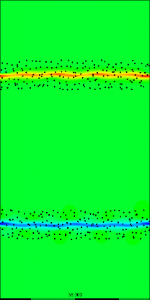 |
 |
 |
 |
 |
| Stk = 100 | 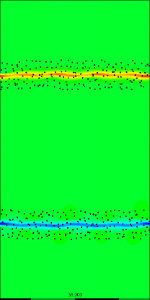 |
 |
 |
 |
 |
Video of Particle Motion for Stokes = 1 Particles
The video below shows the particle motion when the Stokes number = 1. Maximum coupling between the fluid vortices and the particles can be observed.

