TAGGED: apdl, damping, frequency-response, mode-superposition
-
-
November 1, 2022 at 9:02 am
julius.langenhorst
SubscriberHello,
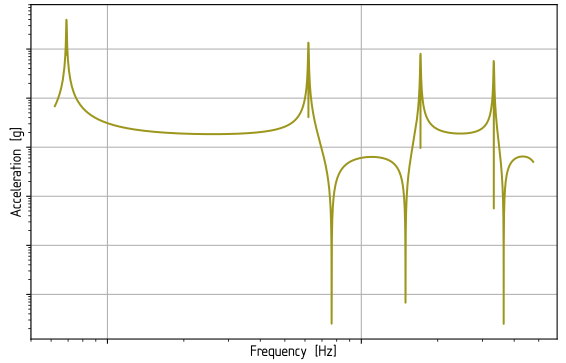
below is an image of a post-proccesed frequency reponse plot. Both axis are logarithmic. Analysis type is MSUP and damping is set to 0.1%. I have trouble interpreting parts of this result.
The peaks pointing upwards are from resonance effects. But why have the last three peaks a line pointing downwards? I guess that it is due to damping but why is the line getting longer at higher frequencies? And what about the peaks pointing downwards? Are those frequencies where the structure is not susceptible to vibration?
It would be great, if someone could help me with my questions.
Thank you!
-
November 2, 2022 at 7:53 am
Florian.CHANCEL
SubscriberHello,
I guess the plot you displayed is a result of one node ?
You can have resonance and also anti-resonance. Resonance means a significant increase of the vibration, Anti-resonance is means a significant decrease of the vibration.
An anti-resonance is also an eigen mode.
The damping is only the shape of peaks.
For steel, is 0.1%, but for welded structure it's higher
-
November 2, 2022 at 8:22 am
julius.langenhorst
SubscriberThank you for your answer!
Yes, the result is from only one node.
I compared the antiresonance peaks with the eigenfrequencies and they do not coincide. Is that normal behaviour? Can the (almost) horizontal areas between two peaks be understood as some sort of base resonance?
If damping affects the shape of peaks, why is the peak pointing downwards and not just cut off?
-
November 2, 2022 at 8:39 am
Florian.CHANCEL
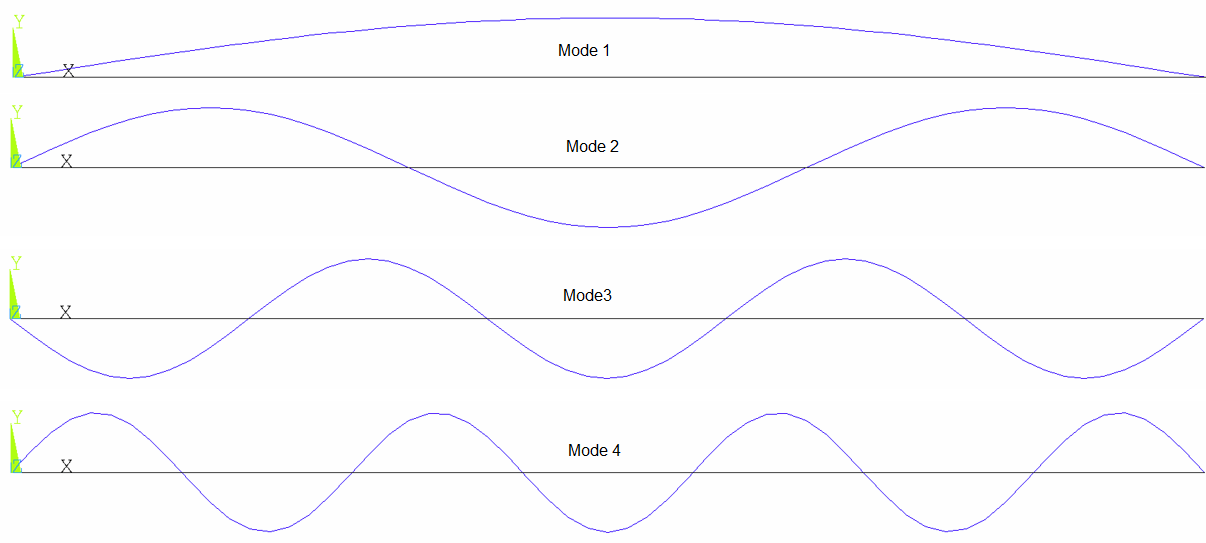
SubscriberCan you show us your model, boundary conditions ? Can you show the shape of the 4 eigen modes corresponding of your plot ?
Normaly, peaks have to be cut off, I don't know why you have peaks pointing downards. Can you try to increase your damping value to see the effect ?
-
November 2, 2022 at 8:51 am
julius.langenhorst
SubscriberIt is a simply supported beam. Element type is BEAM4. Boundary conditions:
DK,1,UX,0,,,UY,UZ,ROTX ! Left end of beam
DK,2,UY,0,,,UZ ! Right end of beam
DL,ALL,,UZ,0 ! Constraints on line
DL,ALL,,ROTX,0
DL,ALL,,ROTY,0The beam is subjected to an acceleration of 5g in Y direction, the plot in my original post is the response. The four modes are:
-
November 2, 2022 at 10:33 am
Florian.CHANCEL
SubscriberOk,
For me, you have not all modes.
Mode 1 : One vibration bely node. and 0 vibration node.
Mode 2 : Two vibration bely nodes, and 1 Vibration node (in the midle).
Mode 3 : Three vibration bely nodes and 2 vibration node ...
etc..
I don't understand why you don't see them all.
I can't help you more, sorry.
-
November 2, 2022 at 10:35 am
Florian.CHANCEL
SubscriberTry to see results from other node, your response will be different, and maybe you antiresonance will change to resonance ?
-
November 2, 2022 at 10:39 am
Florian.CHANCEL
SubscriberIf you superimpose all node results in the same plot, you can extract all eigen frequency of your structure. Some node cannot capture certain eigen mode because their belong to a vibration node ( =0 vibration)
-
November 2, 2022 at 12:20 pm
julius.langenhorst
SubscriberThank you for your answers.
I already have the eigenfrequencies, otherwise I wouldn't be able to do the MSUP analysis. Furthermore, I am not interested in antiresonances, I just wanted to know what those peaks are called.
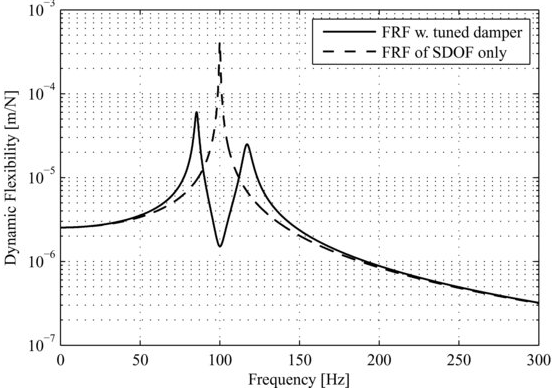
As for the downward facing line at resonance peaks, I found the following picture in the book "Noise and Vibration Analysis: Signal Analysis and Experimental Procedures" (Link). There, a damper is used to damp a resonance frequency which in turn creates an antiresonance and two distinct resonance peaks. This is exactly what happens in my plot (it is visible, if one zoomes in very closely). I'm guessing that the chosen damping ratio is simply to high. I'm not quite sure, though, why some lines are longer than others.
-
- The topic ‘Understanding frequency response plots’ is closed to new replies.


- LPBF Simulation of dissimilar materials in ANSYS mechanical (Thermal Transient)
- Convergence error in modal analysis
- APDL, memory, solid
- Meaning of the error
- How to model a bimodular material in Mechanical
- Simulate a fan on the end of shaft
- Nonlinear load cases combinations
- Real Life Example of a non-symmetric eigenvalue problem
- How can the results of Pressures and Motions for all elements be obtained?
- Contact stiffness too big

-
4167
-
1487
-
1363
-
1194
-
1021

© 2025 Copyright ANSYS, Inc. All rights reserved.


