Hello guys
I am using EDT to simulate an axial flux motor (3D model), and now I want to plot the efficiency map using a machine toolkit.
The question is when I finished simulating the machine toolkit how can i plot efficiency map, current and voltage plots, output power.... same figure above?
can you provide screenshots of your Machine toolkit setup and preprocessing steps ( i mean the explanation of each pages of Machine toolkit setup) or where can i get information to do it ?( i have read Maxwell ACT Extensions Wizards in PDF file and still vague about it)
fig 1: how can i setup this value ?
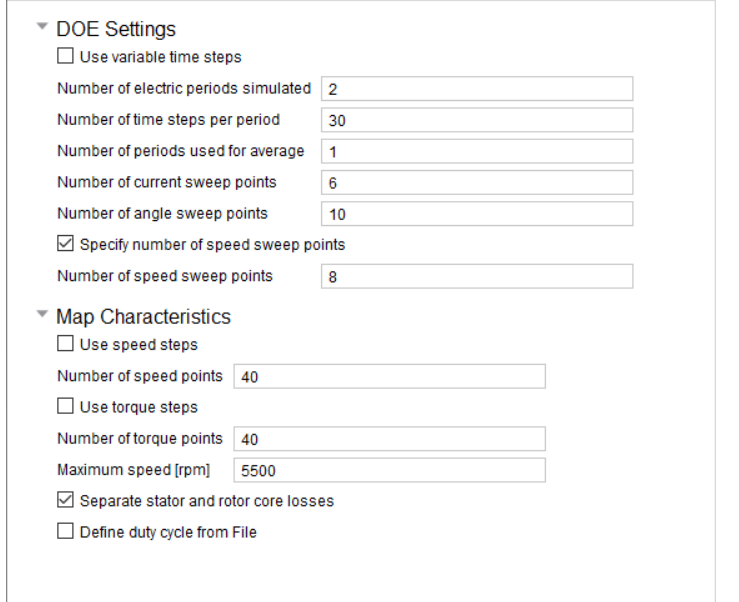
Fig 2: include Ld,Lq computation and winding orientation mean?
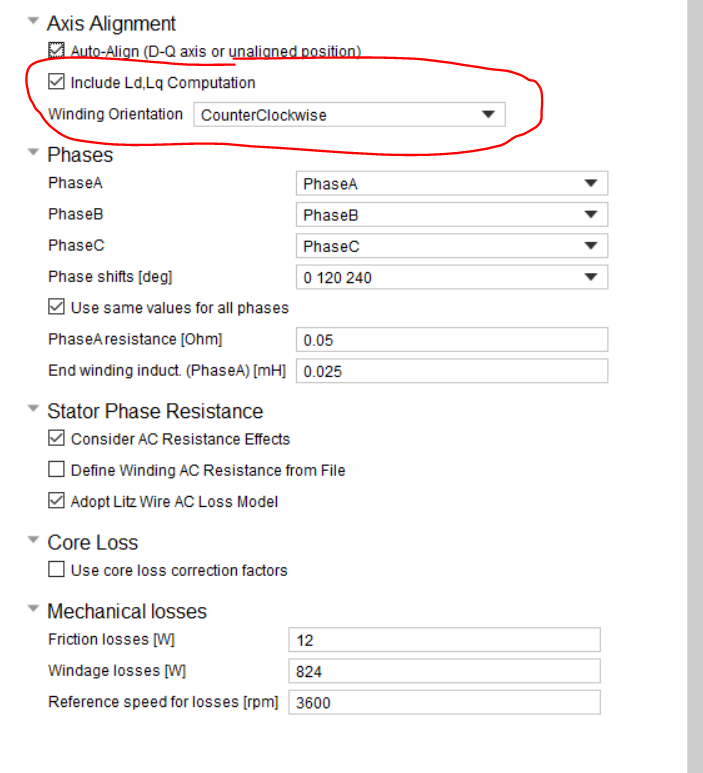
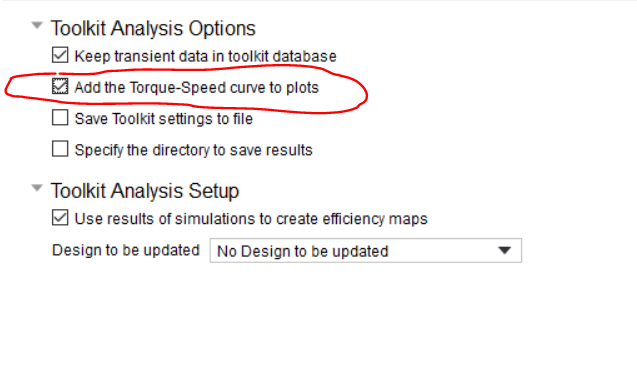
Fig 3: if i select this line i could plot the T-N curve ?
it is perfectly if you can help
Thanks in advance
Pham