-
-
April 18, 2020 at 12:52 pm
vebjorns
SubscriberHello,
I am doing an impact shock analysis on a plate using Explicit Dynamics. I want to generate SRS in MATLAB from the acceleration-time history of a node. My sampling rate is about 1e-6. I read in a different post (link) that "Explicit Dynamics acceleration results are often noisy so you need to filter the data". However, I'm not sure if the solution suggested is the correct one for my application.
As you can see I'm using symmetry and I am using velocity initial condition on the impactor, which is placed close to the plate, but not touching. I am using remote displacement to constrain Ux, Uy, Uz of the corners of the plate. (The mesh is coarse for short solving time).
I have the vibrationdata GUI by Tom Irvine. I have tried to use the Butterworth filter, and it does change the SRS slightly. I only have basic knowledge of filtering. How does my output acceleration data look? If some sort of data processing is necessary, what would you recommend?
Â
Thank you in advance,Â
Vebjorn
-
April 18, 2020 at 2:07 pm
peteroznewman
SubscriberVebjorn,
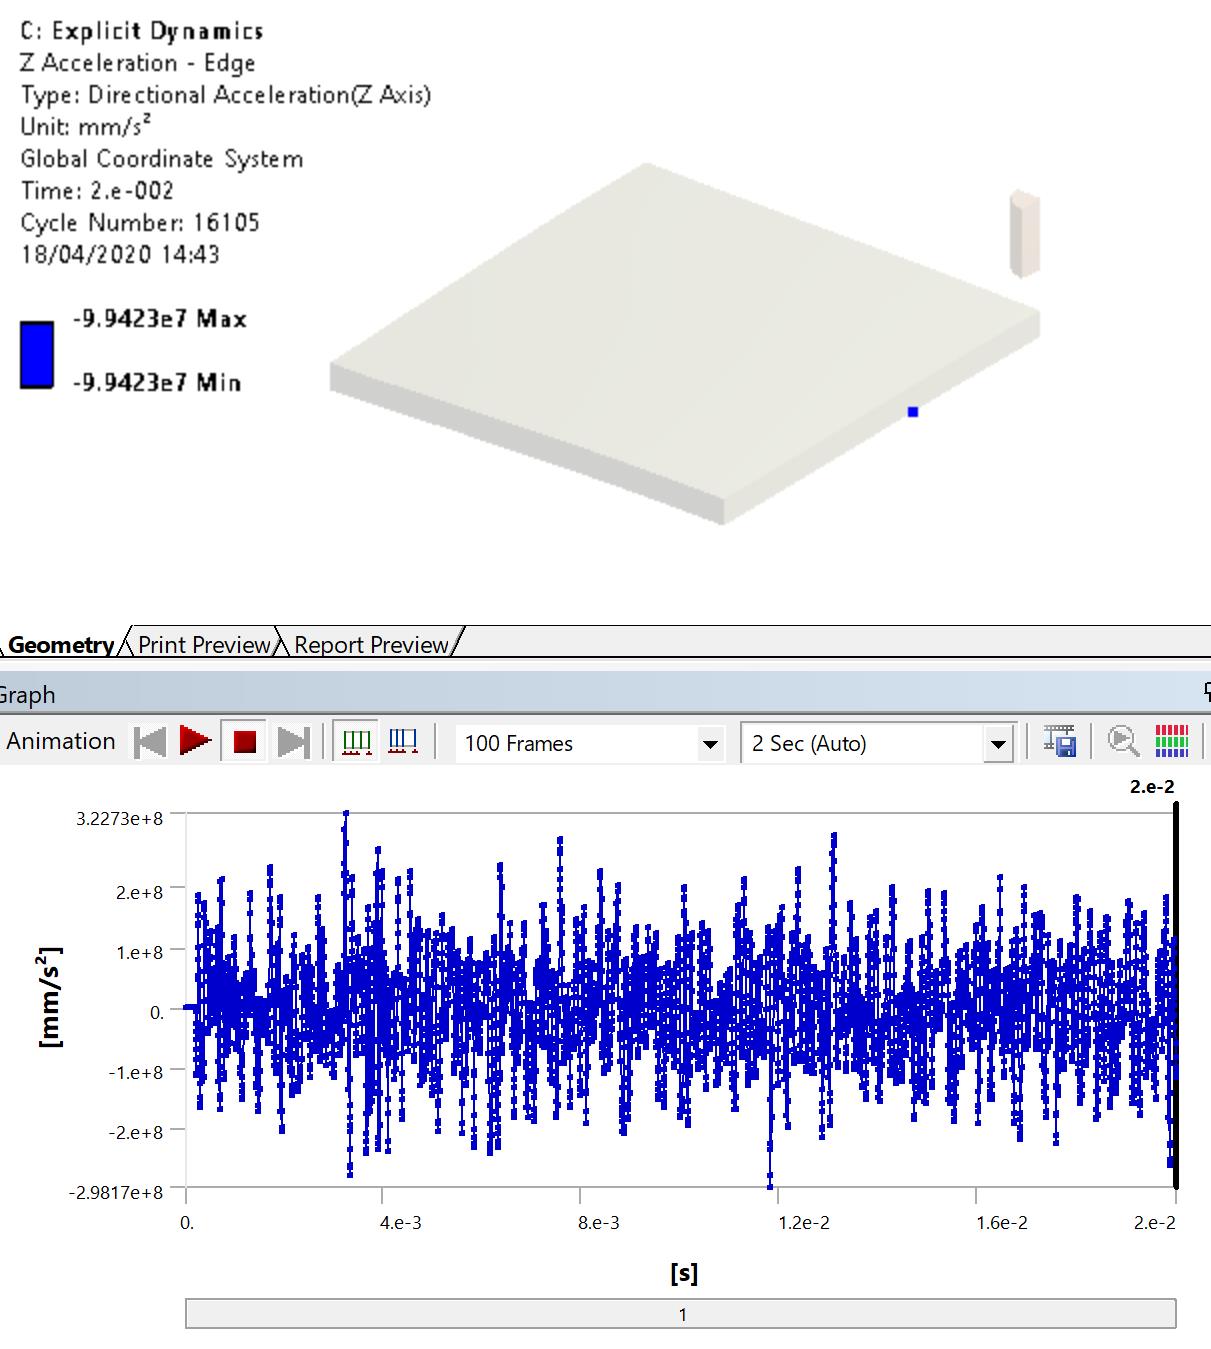
To plot an acceleration from Explicit Dynamics, as was desired in the discussion you linked to, then you need to filter the data.
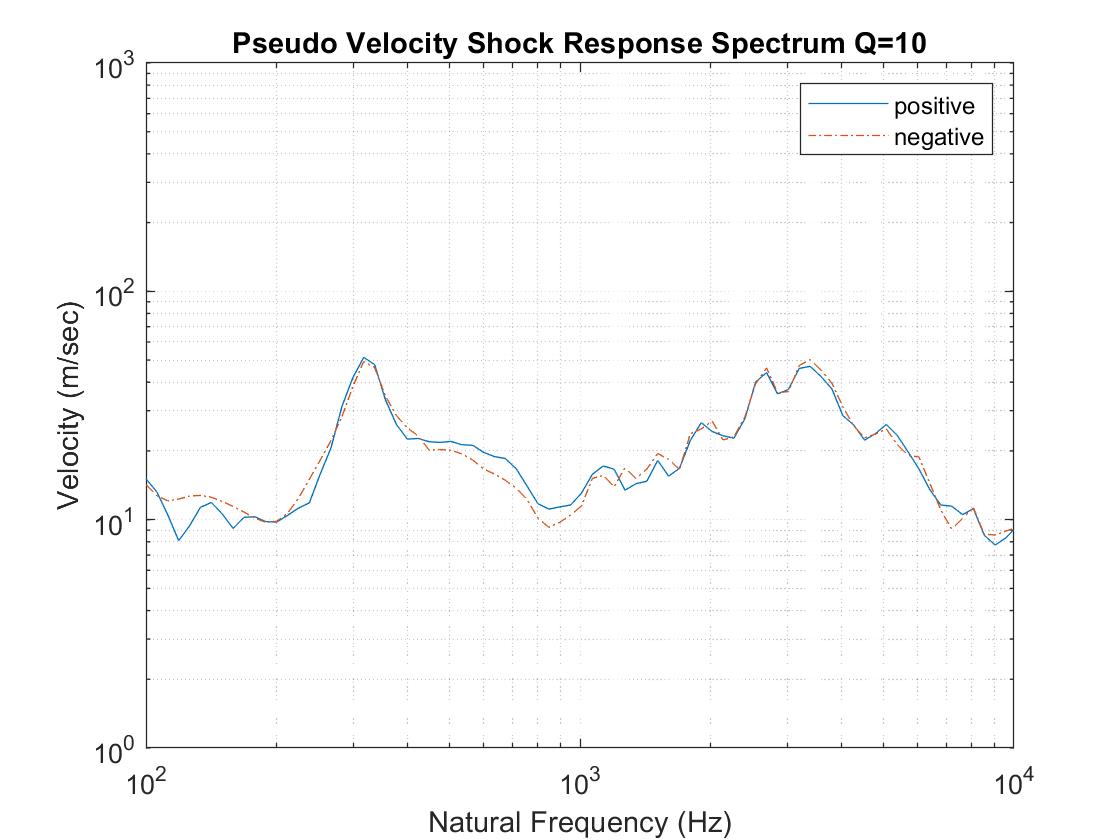
Creating an SRS is a filter operation. You decide on the upper and lower frequency limits to plot the data. That is a filter too.
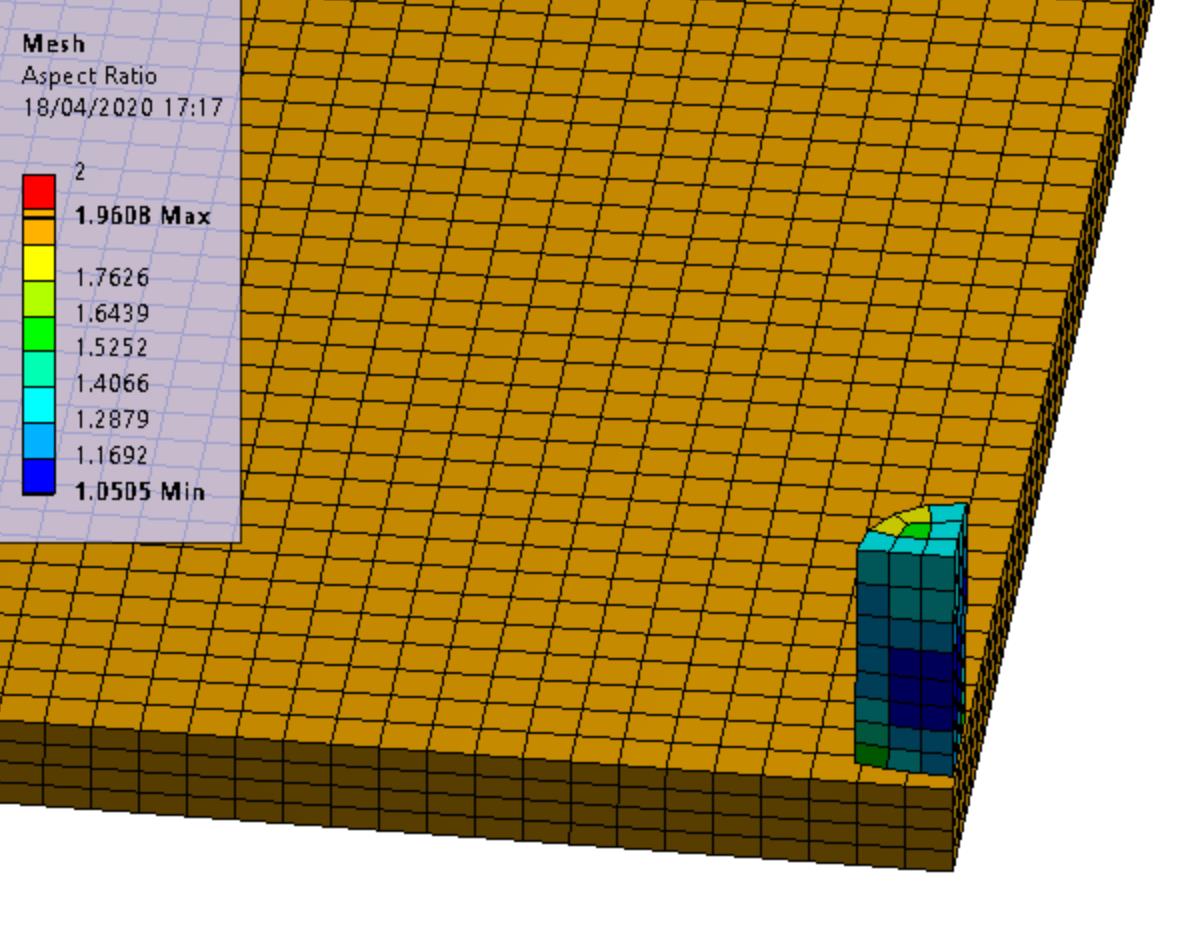
I would not use results from this coarse mesh. The wait time in Explicit Dynamics is mostly driven by the smallest element in the model and less with the node count. With sufficient RAM, there is little incremental wait time by making the plate have elements that are closer in size to the elements in the impactor. You want at least 4 elements through the thickness of the plate and let them have an aspect ratio no more than 2 so if the thickness of the plate is t, then the element thickness is t/4 while the element side length is t/2. It is ideal if the elements are cubic with all sides equal.
The mesh on the impactor has small elements on the axis. Remesh the impactor to have one element on the axis that is similar in size to the elements around the circumference. This will reduce your wait time more than using fewer coarse elements on the plate.
Please make displacement, velocity and acceleration SRS plots and insert the images here once you have your data.
Â
-
April 19, 2020 at 11:16 am
vebjorns
SubscriberHello Peter,
Thank you for you explanation about the mesh, I have a better understanding of how the explicit solver works now, thanks. I have changed the mesh as you suggested. Still, the smallest characteristic length is given by the elements on the impactor. Any less than 2 elements through the radius gives poor element quality. I could change to a square impactor, but I thought the sharp corner would be undesirable (maybe it doesn't matter). I used a bias while sweeping from top to bottom, to have smaller elements near the impact surface.
Â
Â
These are the resulting SRS plots, as you requested. They are recorded from a node 200 mm from the impact position (like in my first picture). The plate is 1m x 1m x 0.3 m (without symmetry). I used a Butterworth filter with lowpass 15000 Hz. May I ask why you wanted to see the SRS velocity and displacement plots? What are you looking for when observing them? I am only used to acceleration SRS.Â
Cheers,
Vebjorn
Â
-
April 19, 2020 at 12:55 pm
peteroznewman
SubscriberHello Vebjorn,
I wanted to see if the initial velocity of the impactor of 50 m/s could be clearly seen in the Pseudo Velocity plot and that is exactly what the peak on that plot shows, how cool is that?
Regards,
Peter -
April 20, 2020 at 2:54 pm
vebjorns
SubscriberHello Peter,
I have been trying to look into this a bit, because I was not using 50 m/s as my initial velocity anymore. I reduced the velocity from my initial shock because I wanted to reduce the amount of energy in the shock. It was actually 27 m/s here. It would have been really cool if you observation was the case, but now it seems like it was a coincidence unfortunately.
Does that mean there might be something in my model? The impactor is not initially in contact with the plate and the measurement location is away from the impact location. After spending some time thinking about it, I would have though the velocity away from the impact point should be different to the initial velocity of the impactor.Â
Here is the pseudo velocity SRS measured at the central node (impact point):
The maximum velocity is 92 m/s and the minimum is 17.4 m/s. I've highlighted the low order velocity, which is similar to the impact velocity. I'm not sure if there is a connection though?
Â
Regards,
Vebjorn
-
April 21, 2020 at 1:32 am
peteroznewman
SubscriberHello Vebjorn,
I am attaching a paper on plotting SRS on four coordinate paper. If a shock has no rebound, then the impact velocity appears as the plateau of the Pseudo Velocity plot, but if there is rebound, then a higher value of PV occurs. Since you were having problems with multiple impacts, you must have a significant amount of rebound.
The paper explains in some detail about the low frequency slope, the plateau and the high frequency slope. I hope you find it helpful. Table 1 in the paper lists Severe velocities. 27 m/s is 1063 ips and that is larger than anything in Table 1. Maybe you should cut that in half again.
Regards,
Peter
-
April 21, 2020 at 3:08 pm
vebjorns
SubscriberHello Peter,
Thank you for the paper. That's very helpful. I will look at reducing my velocity as well.Â
Â
Best regards,
Vebjorn
-
- The topic ‘Do I need to filter node acceleration data from Explicit Dynamics before generating SRS?’ is closed to new replies.
-
6495
-
1906
-
1458
-
1308
-
1022
© 2026 Copyright ANSYS, Inc. All rights reserved.


