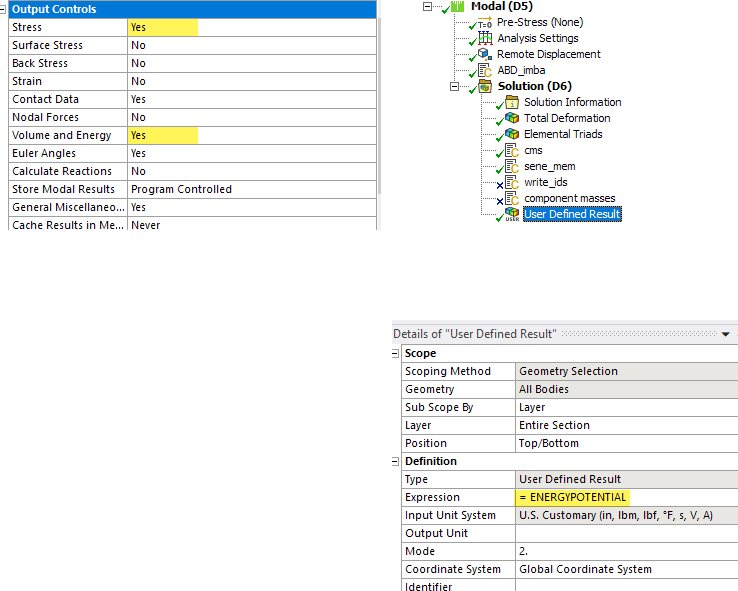
How to plot the strain energy in modal analysis?


Viewing 4 reply threads
- The topic ‘How to plot the strain energy in modal analysis?’ is closed to new replies.


