-
-
July 21, 2022 at 9:58 pm
mkalel
SubscriberI am trying to do a modeling/simulation which is about a thermal analysis in a DED (laser + hot wire) metal additive manufacturing. For that I am using ANSYS built DED Process in a workbench . for the simulation I was able to create a G-code and to set the tool path for the printer in the simulation but I have some question regarding the simulation.
question1: Regarding the simulation, In the real experiment, we are changing the parameter like (laser power) but i didn't see any laser power input option in the DED wizard, it just ask me the wire feed speed and process temperature. So my question how can I account for the different parameter in the simulation?
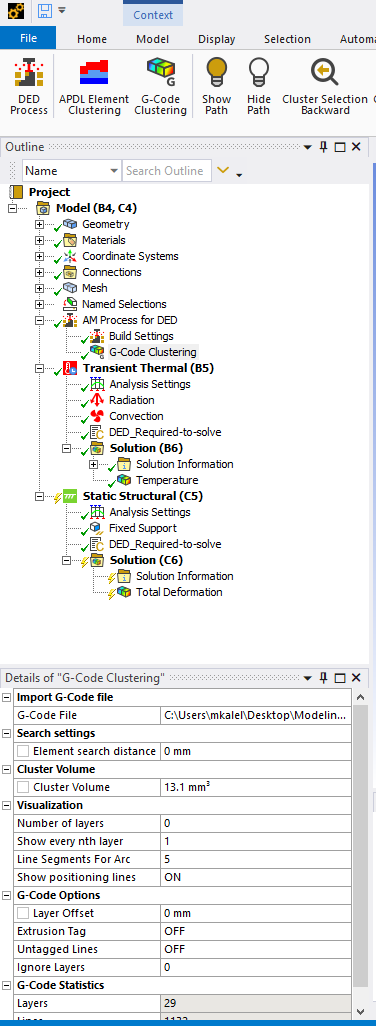
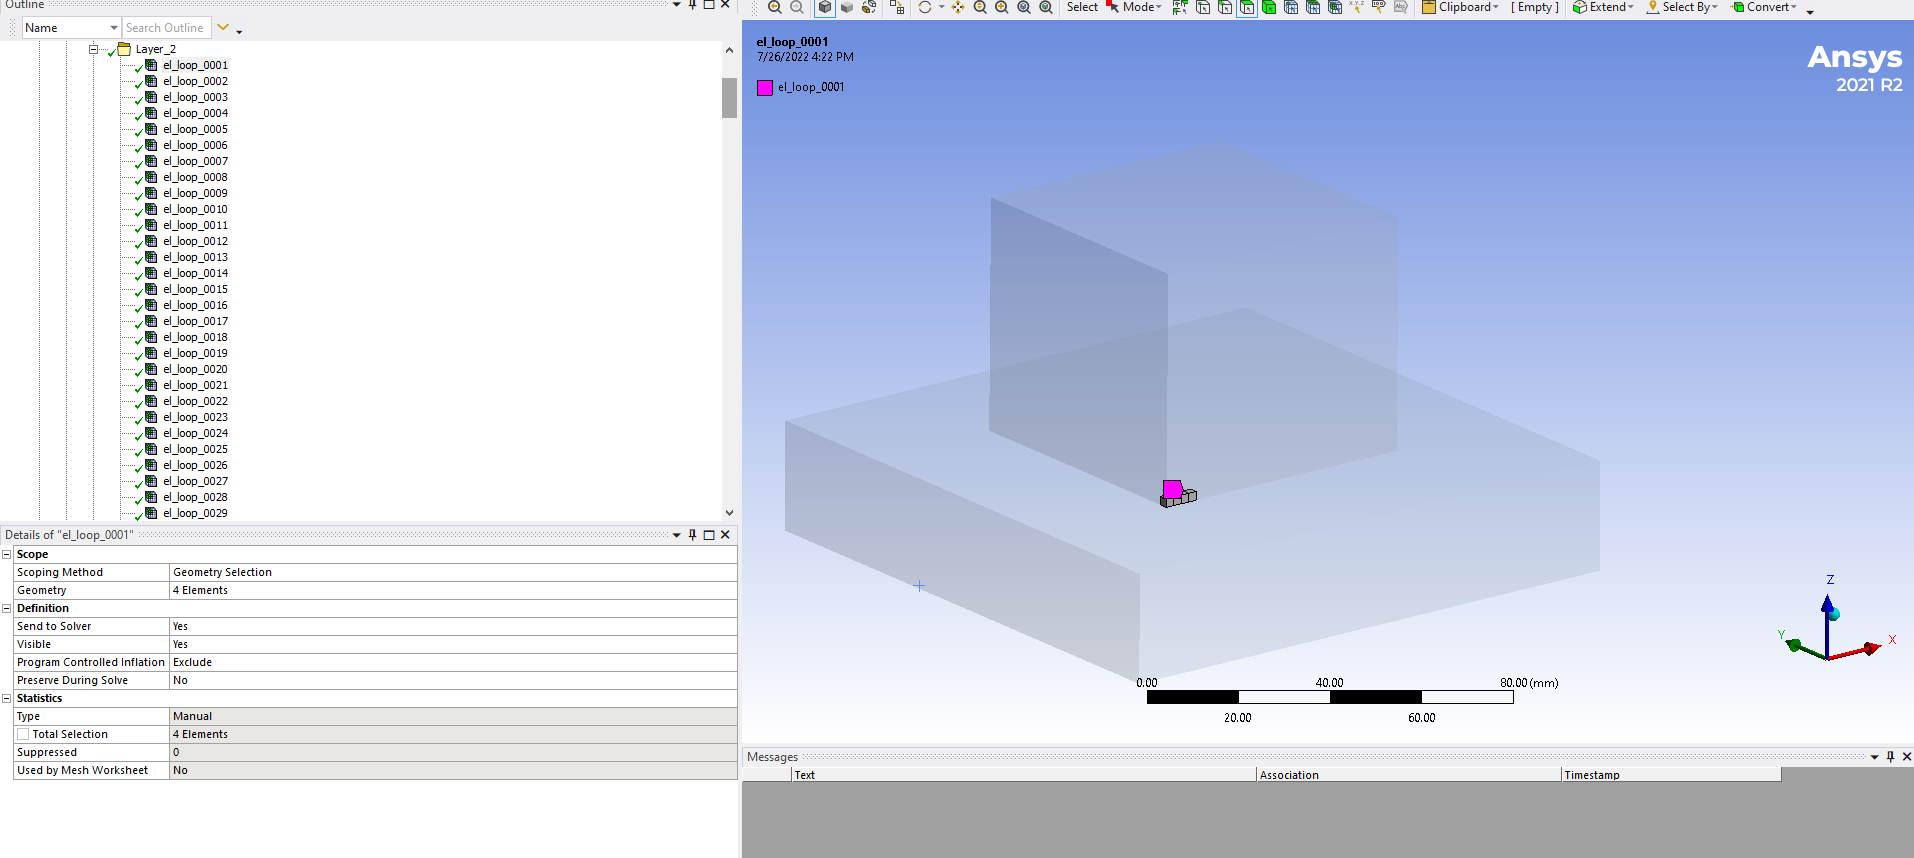
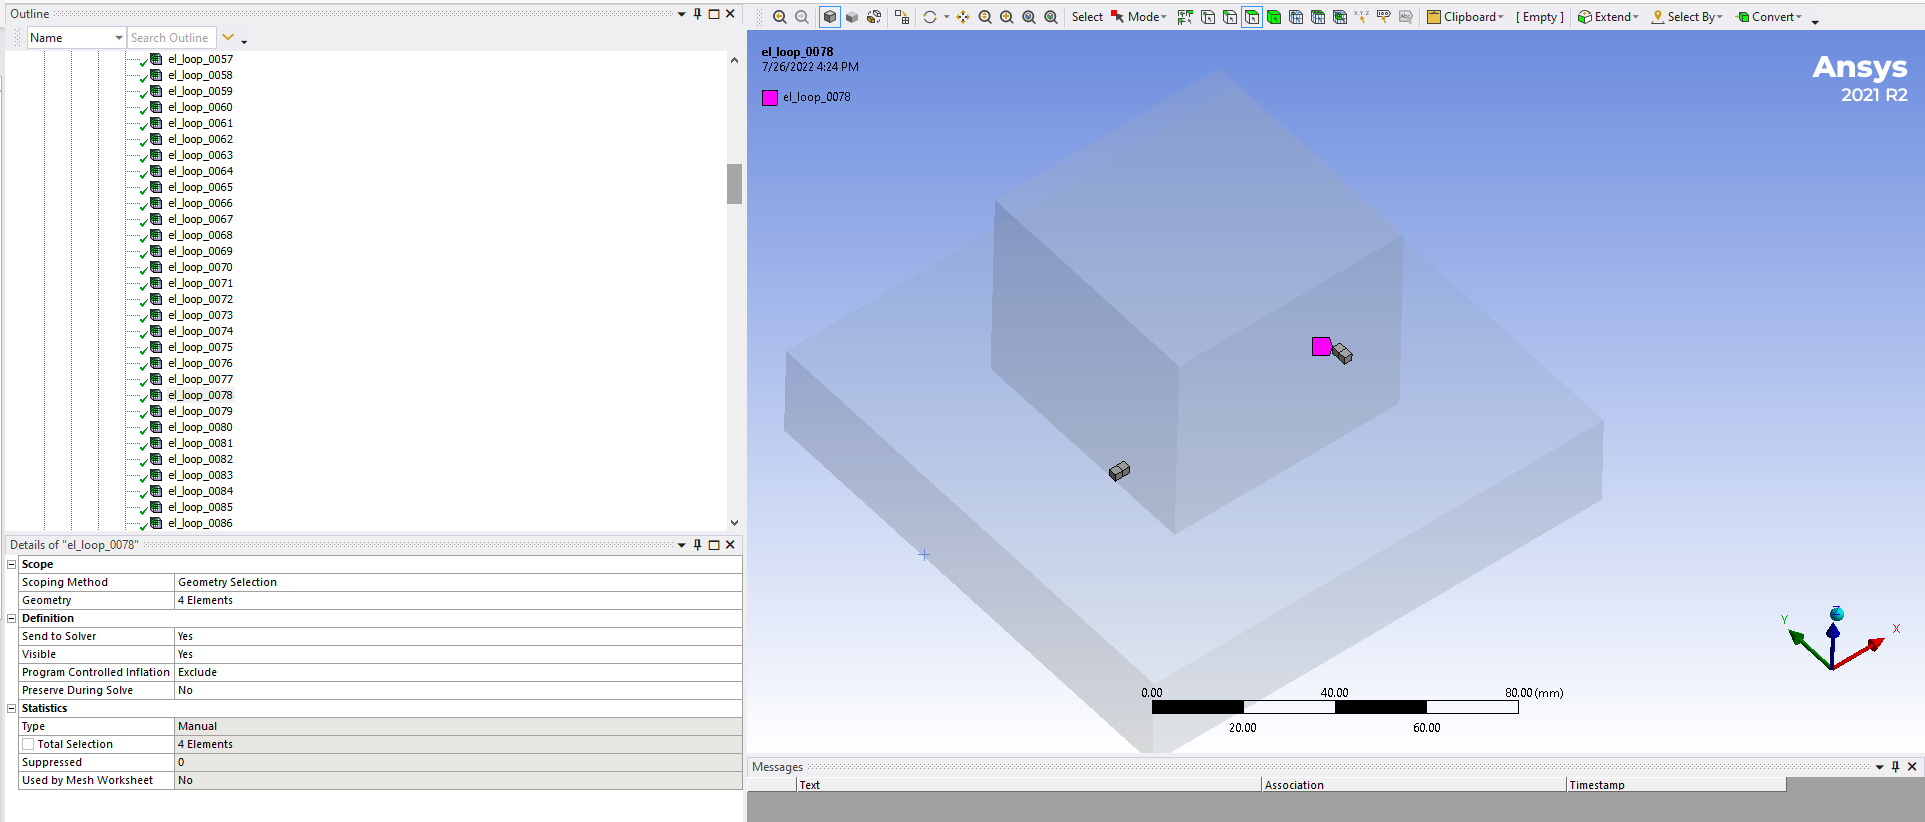
Question 2: I am having trouble with element clusttering. How do I know that how much clustter volume do I need to set? I was trying different value and ANSYS grabs volume very randomly when I set to specific value. I mean Is there any way that I can create cluster in certain nodes from certain section?how can I do that? I already got the G-Code.
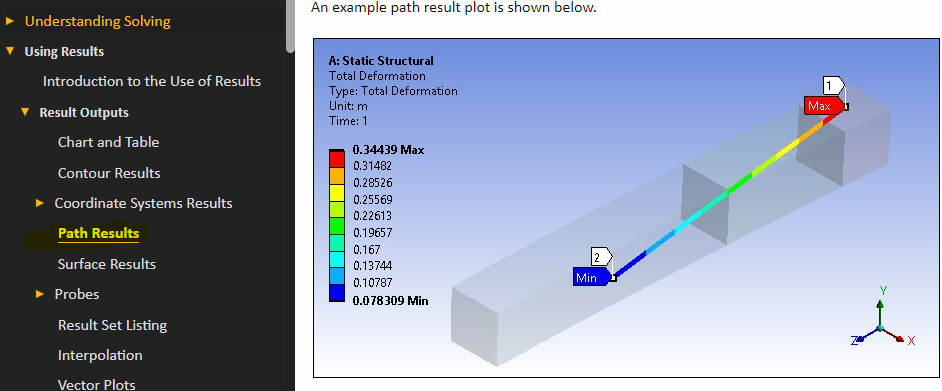
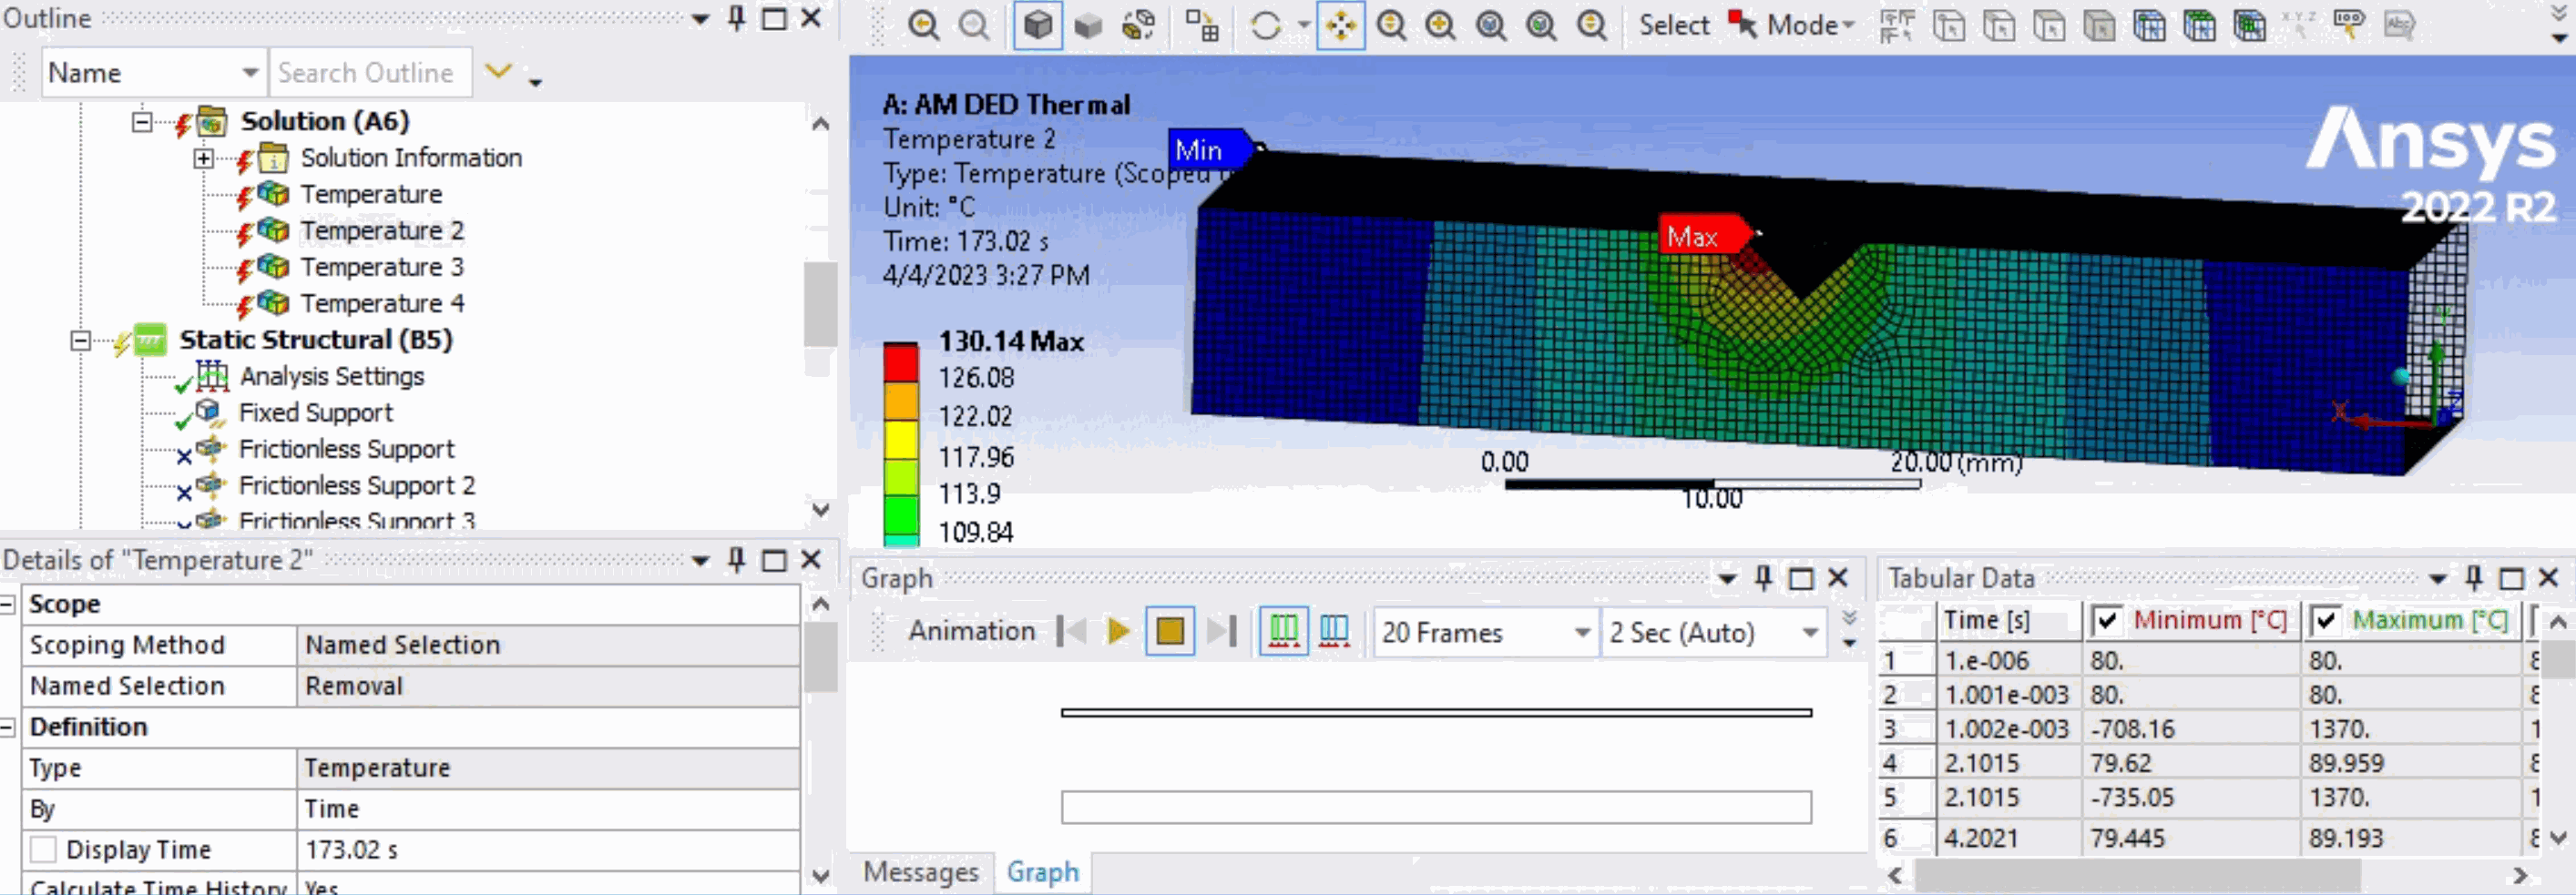
question3: I want to get a nice graph that could show me the top to bottom temperature profile which I can compare with Experimental data. (simulation and Experimental comparison) how can create that line to obtain a graph?
For other BC like radition and convection, Do I have set it to a tabular data or step applied? All i got is the value of emissivity and convection coefficient?Â
let me know if I am missing any other BC because this is my first attempt,
Â
Â
Thanks,
MukeshÂ
Â
Â
Â
Â
Â
-
July 26, 2022 at 7:56 pm
John Doyle
Ansys EmployeeQ1. Ansys DED does not apply heat load to each cluster. As with L-PBF, the load is the process temperature (usually the powder melt temperature). The key difference between L-PBF and DED is that L-PBF activates an entire element layer without regard to laser path. DED activates element groups(or clusters) in a stratigic pattern (consistent with the order in which material is actually laid down during the build. Also DED allows for convection from the surface of activated element clusters to the enviroment.
Q2. Smaller cluster size should improve accuracy at the expense of run time.
Q3. Not sure if this will give you what you are looking for, but could you use a path plot? You would have to create this after all the elements are activated at the end of the build. Â
Â
-
July 26, 2022 at 8:39 pm
mkalel
SubscriberHello @johndoyle,Â
Thank you for the very helpful reply. I appreciated you help.Â
I was successfully able to create a path and got the data to compare with my experimental value.Â
But now the big problem is when I did the element clustering, I set it to the very small size and I see the tool path/printing path from my G-code. I noticed the very weird thing.
- I was planning to grab the cluster of cube of around 6-8 element and make it symmetric to all the layer. But when I check the cluster volume by generating the G-code clustering, Its not even so symmetric even in the first layer. I wish I could share the video of my problem and may be that the good way to explain my problem. I double checkmy G_Code and all I am changing is the co-ordinate of the Z-axis( hight of z axis). It should be same cluster volume to every different layer through z-axis as I am not changing anything (co-ordinates) x and y on my Gcode. How can I make a symmetric cluster volume or symmetic path to every different layer.
- I have 28 layer but Element clusttering different in 1st layer and different in 28th layer. When I animate the result. It grabbing the element while printing simulation so randomly which doesnot even make sense. but the first layer seems okay. The Gcode of the first and 28th layer is 100% same in x and y co-ordinates all I am chaning is the z axix which is a height.
- I really need a support on this from ANSYS. Is there anyway that I can get a support like appointment with someone who can help me with the issues. I think it would be good way to describe my problem?
- I am taking some screen shot of the clusttering that I have been facing , Hopefully it will make easier to understand my problem.
- I have tried to do a screen caputre of the element clustering volume pathand upload to a dropbox i guess that will help to understand. please focus on the last 15second on the video.
- here is the link:Â I have uploaded a link as an attachment as well;https://www.dropbox.com/s/cidsis0hq56rt4p/Gcode%20problem.mp4?dl=0
Thank you for the help,
MukeshÂ
Â
Â
-
August 4, 2022 at 2:07 pm
John Doyle
Ansys EmployeeI would encourage you to pursue support and/or consulting services thru these channels. Customer Support and Help Desk: Submit a Request | Ansys Engineering Simulation Consulting Services | Ansys -
December 21, 2022 at 1:56 pm
Bharath Chodavarapu
SubscriberMay I know, which software & how your are able to generate Gcode of the sample?
-
December 22, 2022 at 8:26 pm
John Doyle
Ansys EmployeeYou could try "ReplicatorG", an open source GCODE generator that you can download for free. Â
G-Code is a CNC programming language that is most commonly used to program tool paths on conventional machines for conventional automated manufacturing operations.
It just happens to also be helpful to simulate the strategic activation of layers of elements, based on the lasor scan pattern, in a AM- DED simulation.
Â
-
April 4, 2023 at 2:29 pm
Rory Boyd
SubscriberI have been undergoing a simulation on Mechanical DED Wizard involving Directed Energy Deposition, I am trying to simulate the process and find the residual stresses. I have came to a problem regarding the temperature histories which directly impact the static structural results. The temperature fluctuations are far too high and i cannot seem to fix this, the process involves using the DED wizard with a print and base part using material Inconel 718. Any support would be appreciated. -
April 4, 2023 at 2:33 pm
-
- The topic ‘Thermal simulation DED process, Finite element analysis, 3d printing AM’ is closed to new replies.
-
6495
-
1906
-
1458
-
1308
-
1022
© 2026 Copyright ANSYS, Inc. All rights reserved.

